


Introduction
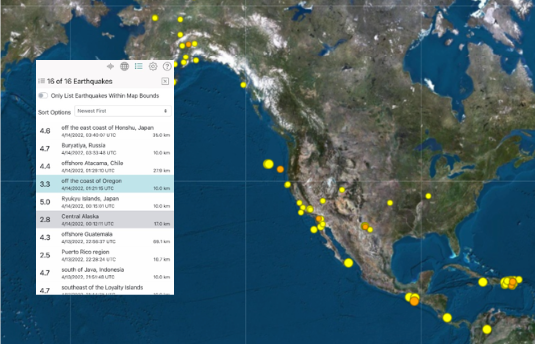
QuakeMap is an earthquake notification application that allows users to view vital earthquake hazard information. Its responsive design helps ensure an optimal experience by adapting to your screen size, whether mobile, tablet, or desktop (Figure 1, Figure 2, and Figure 3, respectively).
Figure 1. QuakeMap on a Mobile Phone
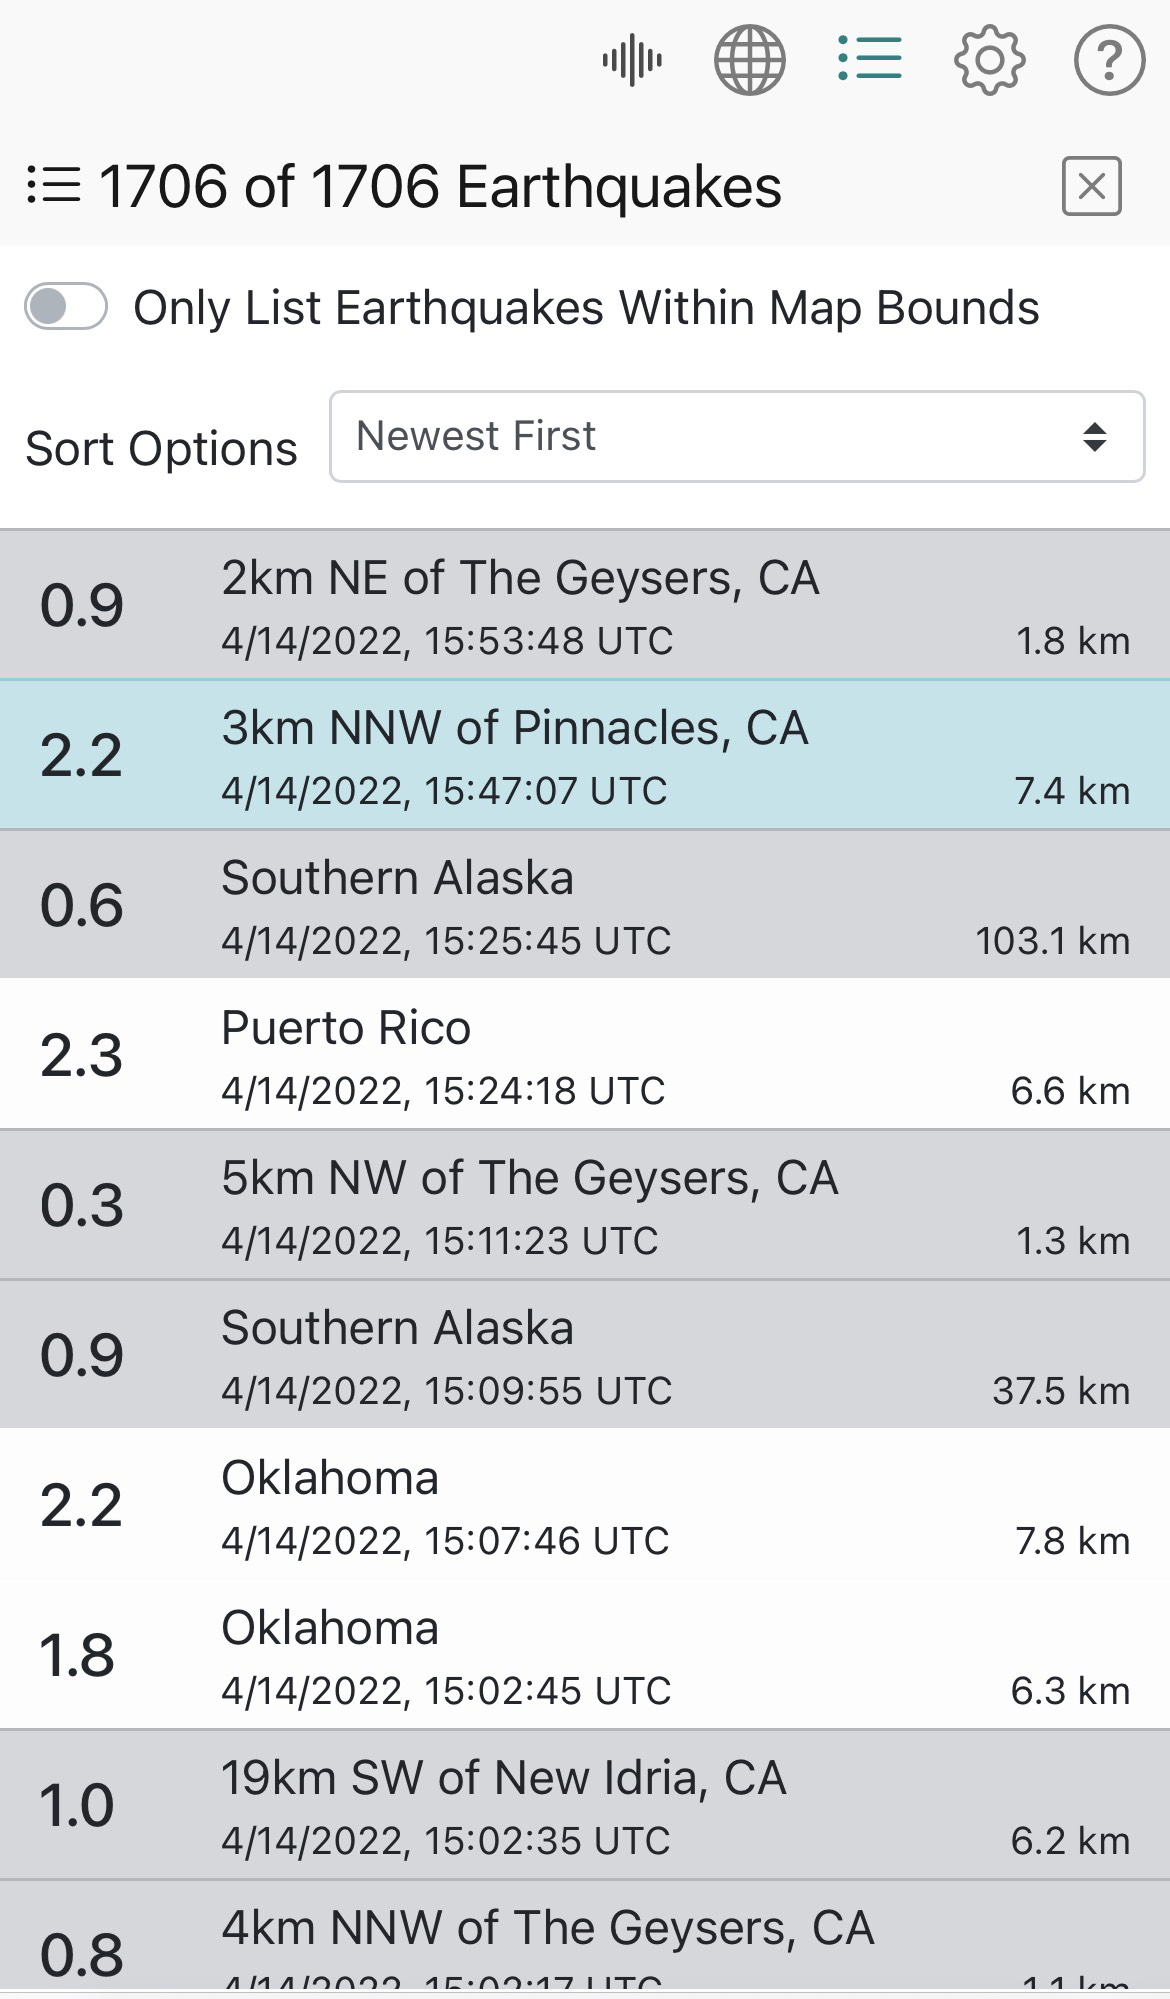
Figure 2. QuakeMap on a Tablet
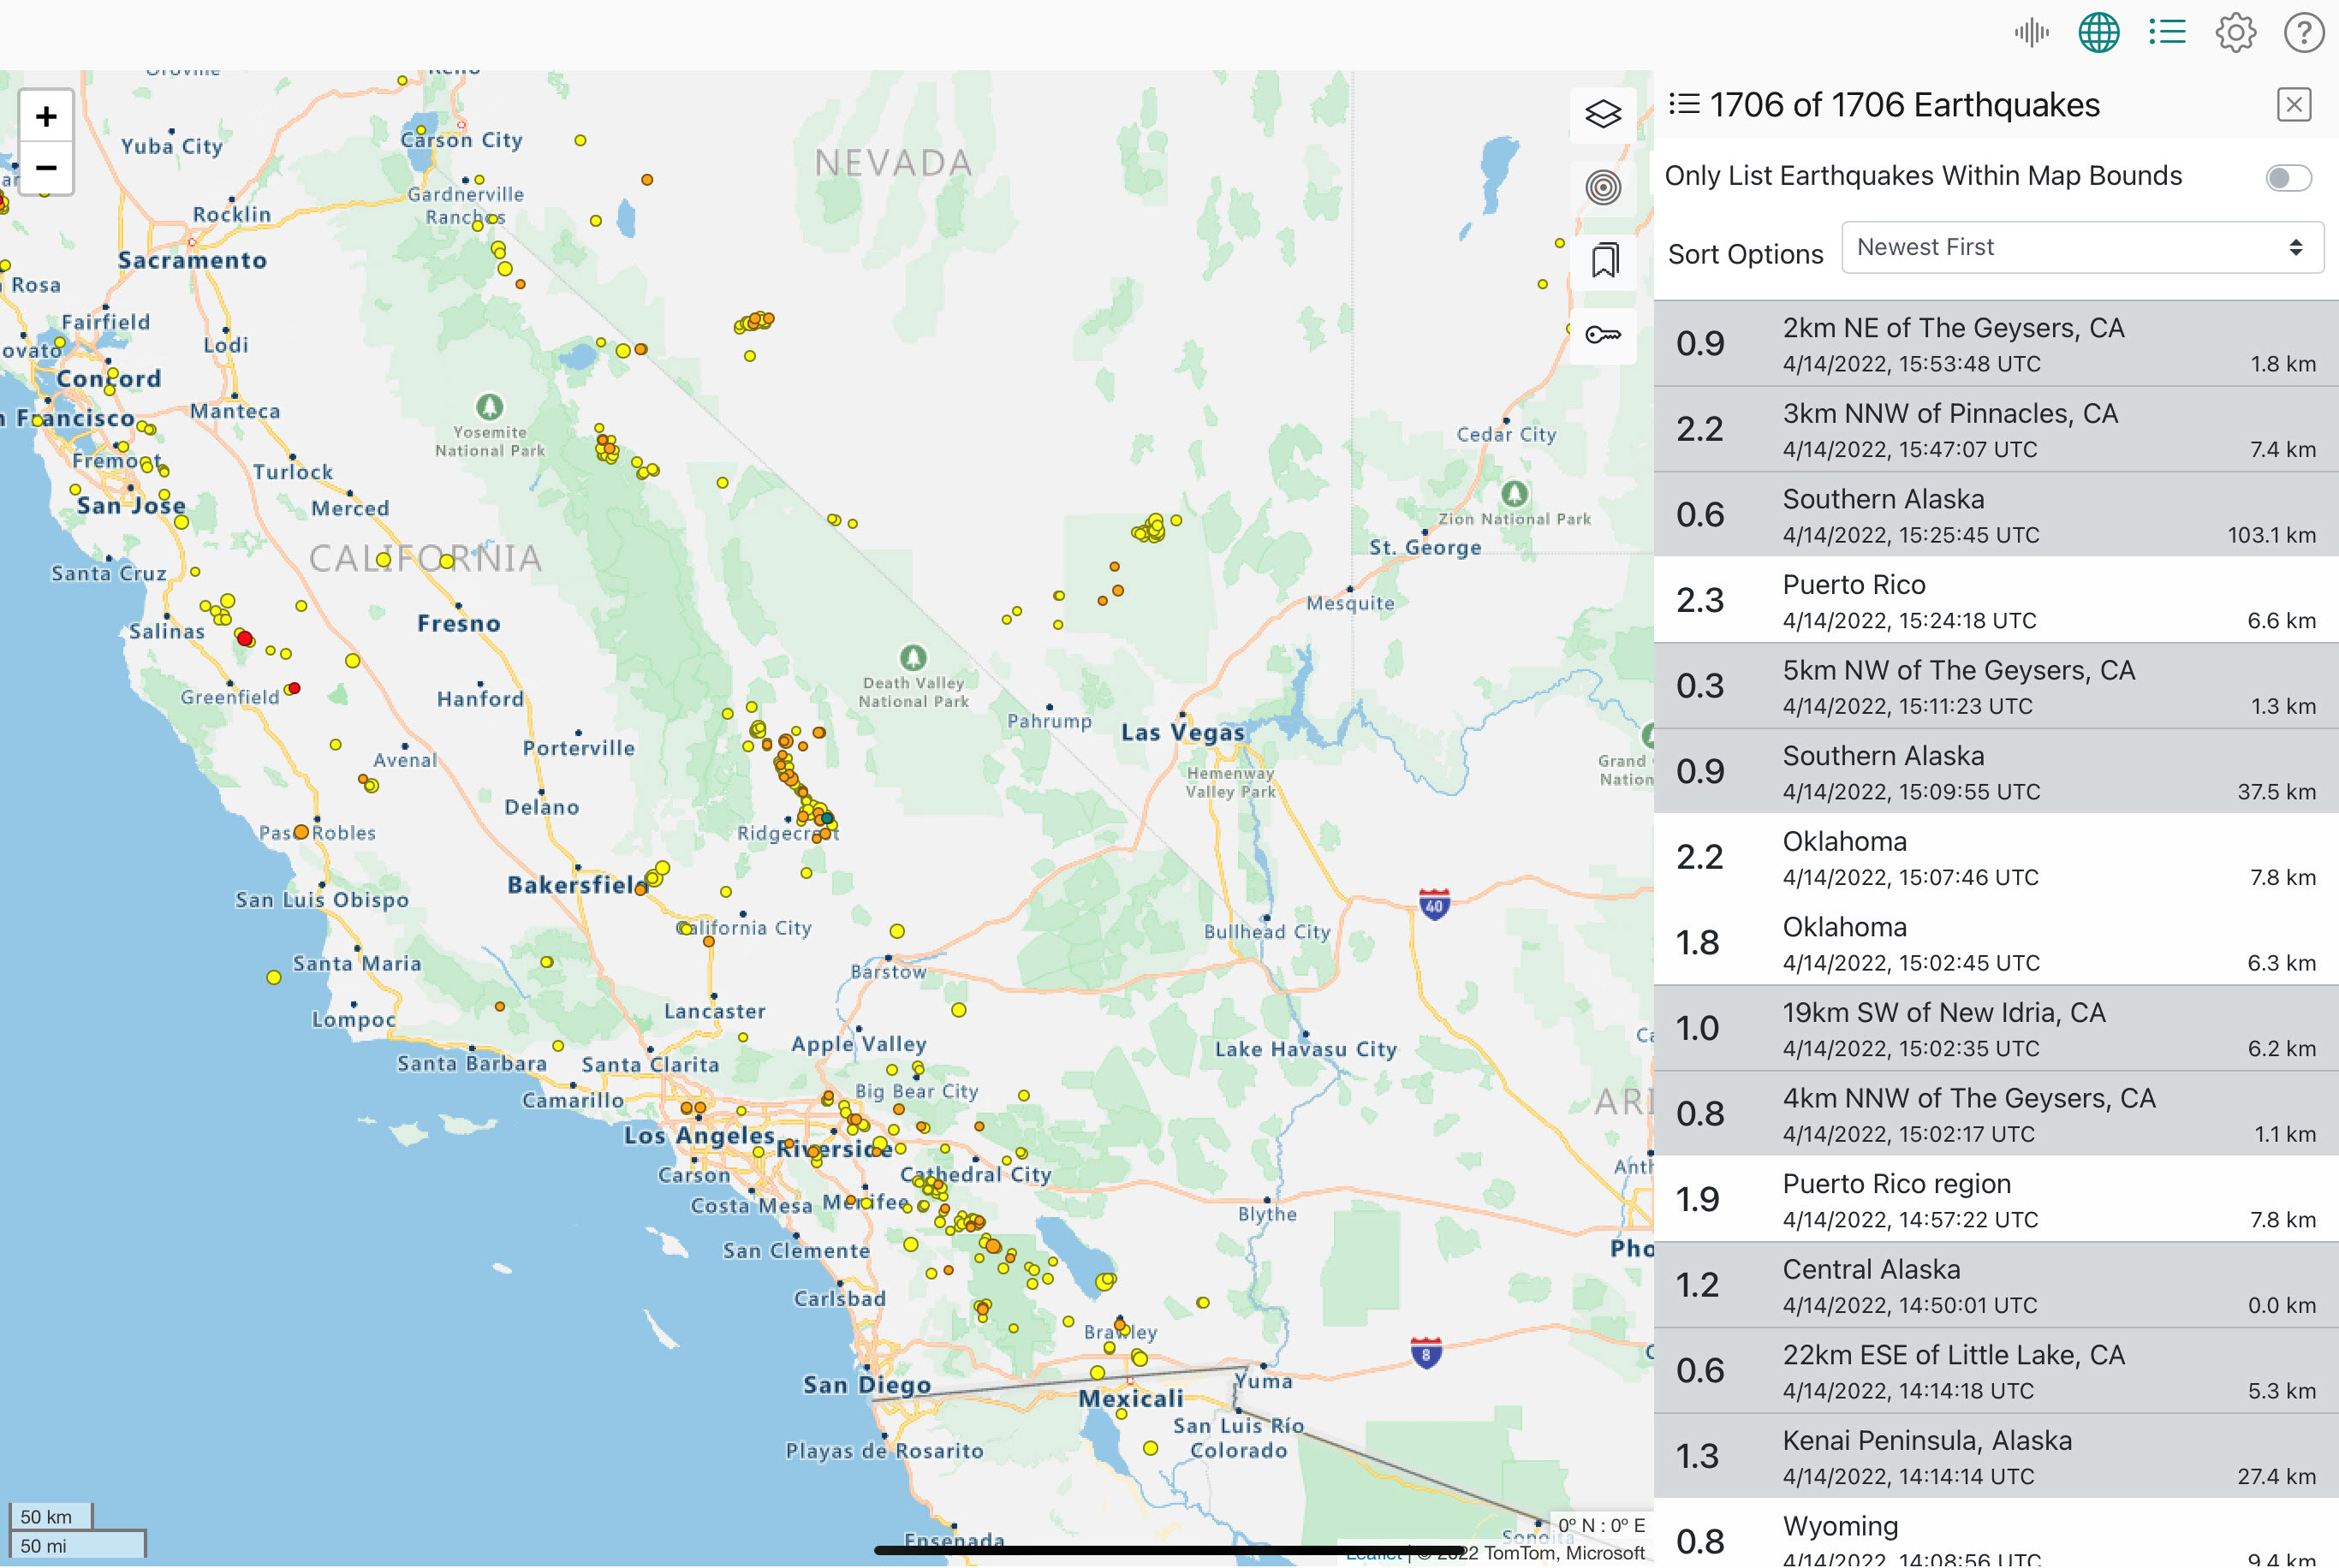
Figure 3. QuakeMap on a Desktop
About This Document
This document is a comprehensive guide to QuakeMap for emergency responders, consumers of critical information who help formulate a rapid and organized response to an earthquake or tsunami emergency, and the general public. It includes step-by-step directions for navigating the application, working with the map, viewing the event list and details, and configuring settings.
Document conventions include bold text for the names of buttons, icons, checkboxes, names of elements, and elements clicked or selected by a user, e.g., “Select the Map icon from the menu.”
Gateway to Other Earthquake Products
As a portal that provides all relevant earthquake hazard information produced after an earthquake, QuakeMap facilitates the rapid distribution of additional online tools and services useful to emergency responders. QuakeMap displays any web-based products currently available for an event, including, but not limited to, ShakeMap, Did You Feel It?, Tsunami Warning messages, and Focal Mechanisms. ShakeMap, which displays the pattern of ground shaking, can be added as a layer for applicable events. URLs and detailed information related to these, as well as other Internet products, are automatically created for each event and made available, giving users quick access to crucial decision-making information.
Development Partners
QuakeMap is a cooperative project of the California Integrated Seismic Network (CISN). CISN members include the California Geological Survey (CGS), the United States Geological Survey (USGS), the California Governor’s Office of Emergency Services (OES), the California Institute of Technology, Seismological Laboratory, and the University of California, Berkeley, Seismological Laboratory. OES, USGS, FEMA/OES Hazards Mitigation and Emergency Management Performance Grant Programs, and the National Tsunami Hazard Mitigation Program of the National Oceanographic and Atmospheric Administration (NOAA) provide funding for the project. Instrumental Software Technologies Incorporated (ISTI), a geophysical software development company known for its seismology and nuclear physics expertise, developed CISN Display and QuakeMap. ISTI also provided in-kind support.
Getting Started
This section of the user guide contains information on the user interface, system navigation, settings, tooltips, earthquake popup summaries, and what you can expect to see in the QuakeMap application.
User Interface
Layout
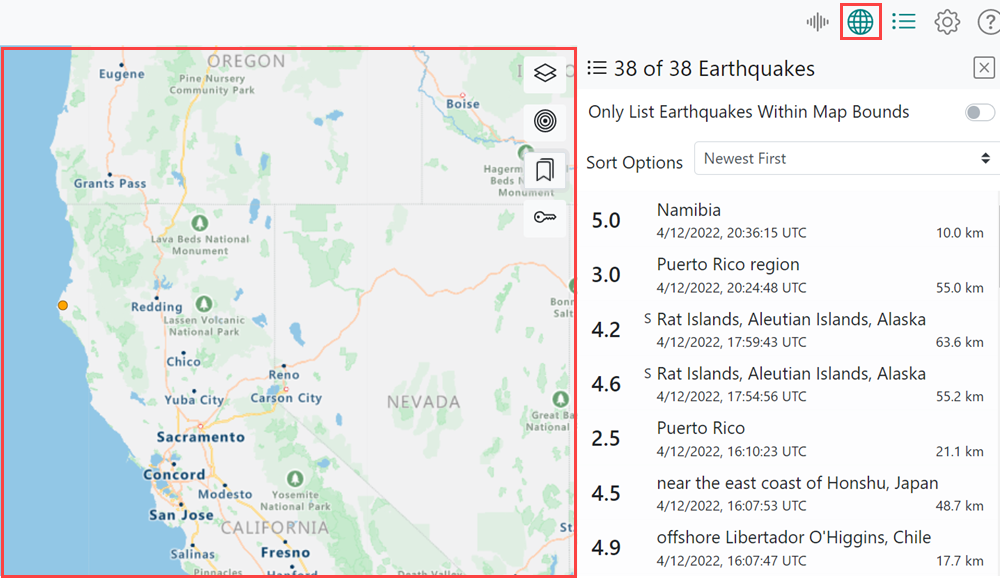
When you enter QuakeMap for the first time, you see the default view shown in Figure 4, which highlights the menu, map, map icons, and list.
Figure 4. Default View of QuakeMap User Interface
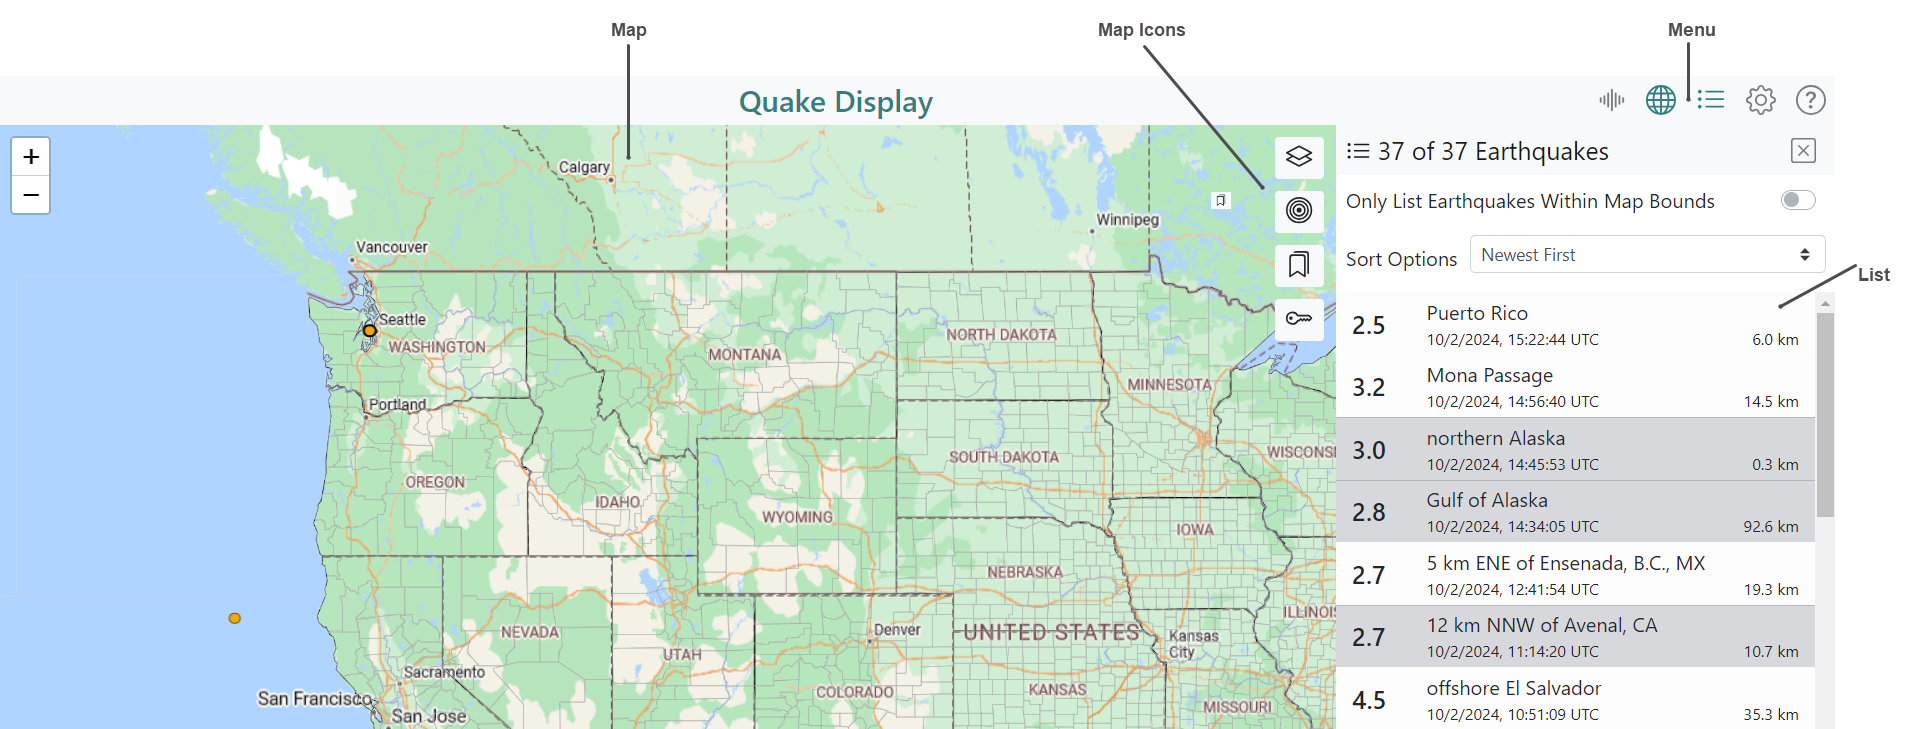
QuakeMap’s user interface comprises five primary areas, hereafter referred to as panes: Details, Map, List, Settings, and Help. Each pane is accessible from the menu shown in Figure 7.
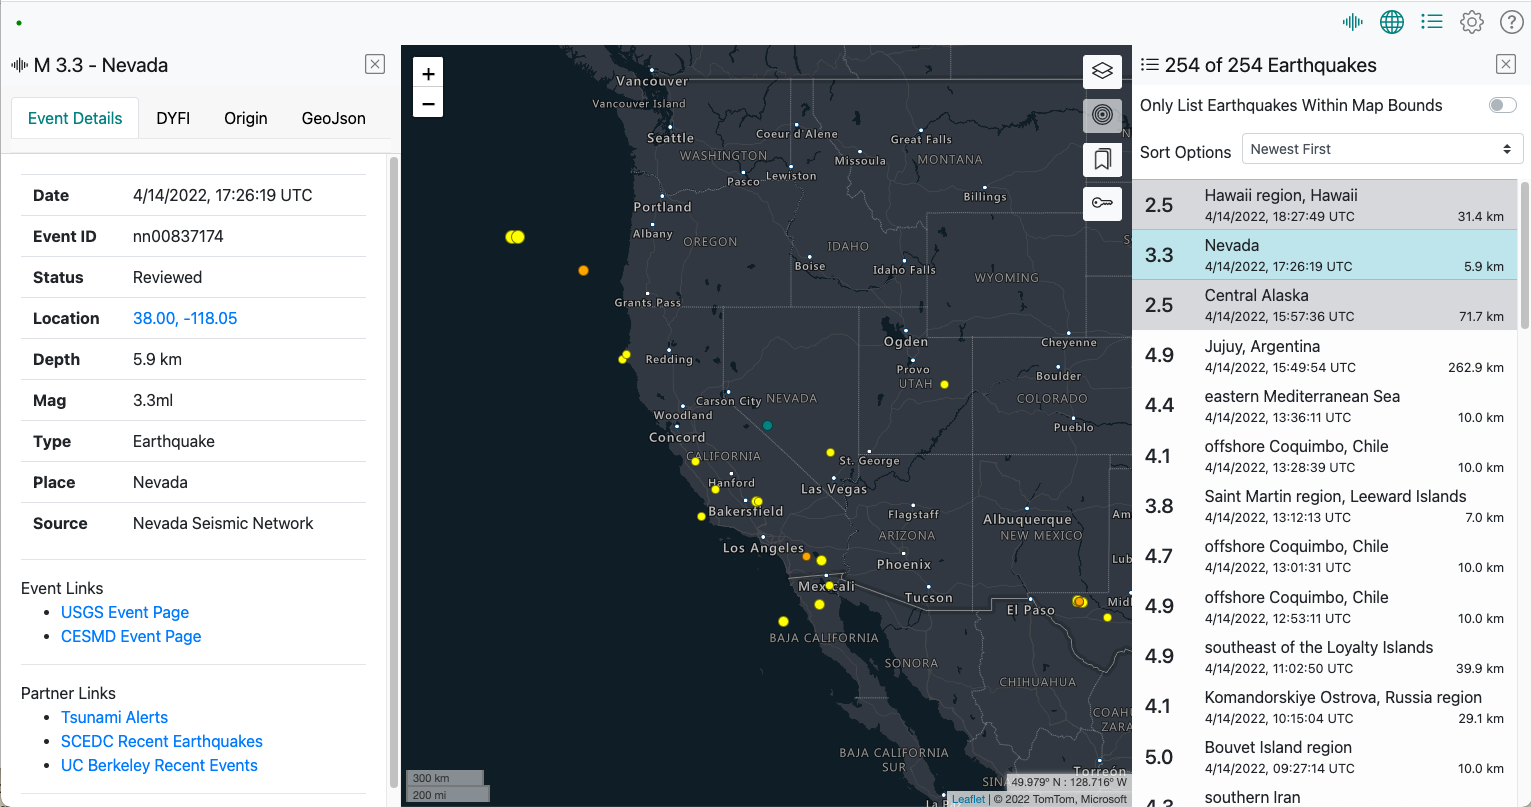
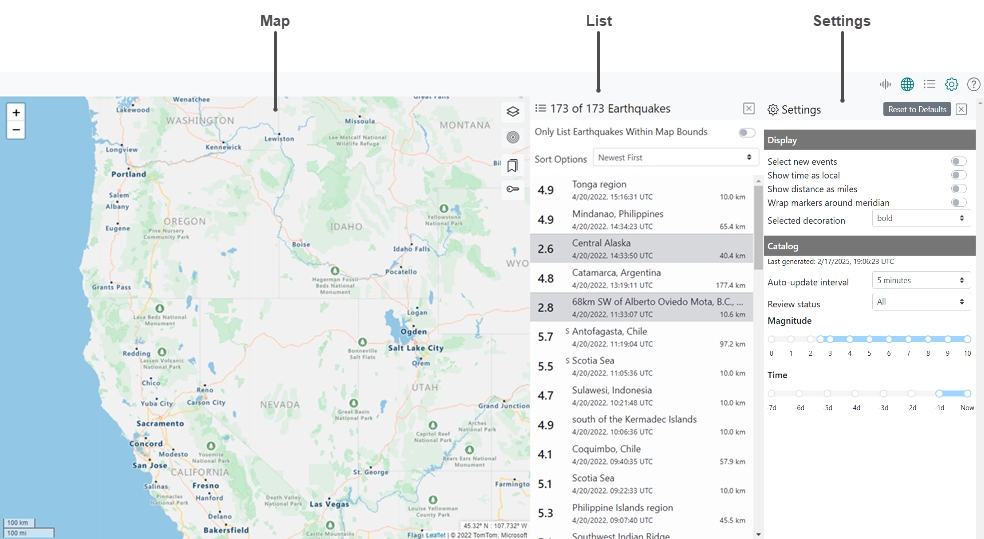
QuakeMap has a multi-pane layout to optimize the viewing of all critical earthquake hazard information. Except for the Help pane, which opens to the entire screen’s width, each pane opens beside any others open at that time. Figure 5 shows the Details, Map, and List panes open simultaneously. Figure 6 shows the Map, List, and Settings panes open simultaneously. You can open up to four panes at a time.
Figure 5. Example View of Details, Map, and List Panes Open Simultaneously
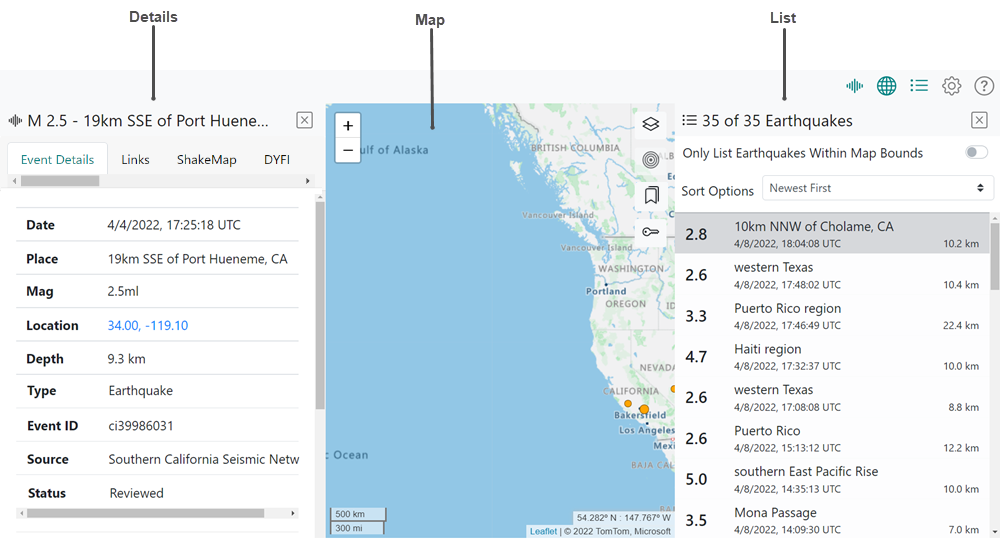
Figure 6. Example View of Map, List, and Settings Panes Open Simultaneously
Each pane has a unique width, as described in Table 1.
Table 1. Pane Widths
| Pane | Opens with |
|---|---|
| Map | Variable width – width varies depending on how many other panes are open. |
| List, Details, Settings | Fixed width – always opens at the same set width, regardless of how many other panes are open simultaneously. |
| Help | Full width – always opens at full width, obscuring any other open panes; however, once you close the page, the system returns you to your [other] open panes. |
There are two ways to close a pane:
Re-click the icon for the pane you want to close.
Click
 to exit from the pane.
 |
The Help pane opens to the entire screen width. All other panes open to full width only when they are the only pane open; when one or more panes are open, they share the screen equally. The only exception to this is the Help pane, which always opens to full width. When you exit from the Help page, either by clicking the Help icon or the , the system returns you to your screen as you left it. |
Navigation
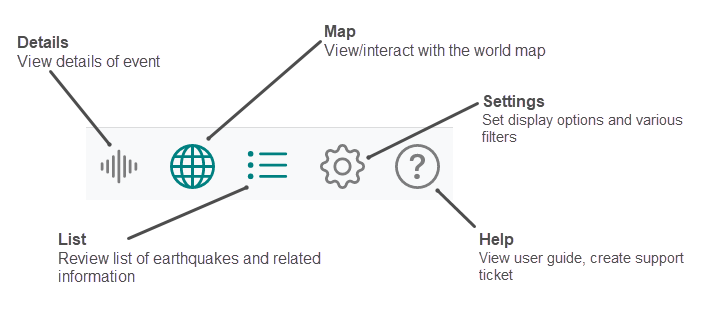
Using the menu shown in Figure 7, navigate to the user interface’s five panes: Details, Map, List, Settings, and Help.
To open any of the five panes, click their respective icons in the menu. Clicking an icon the first time opens a pane; clicking an icon a second time closes it.
Icons in the menu are gray until you select one, at which time it turns green. An icon stays green until you click it a second time or you close the pane it controls; the icon then turns back to gray.
Figure 7. Menu
Sliders
QuakeMap uses sliders that enable you to set magnitude and time ranges for earthquakes. Elements of a slider are shown in Figure 8.
Figure 8. Elements of a Slider
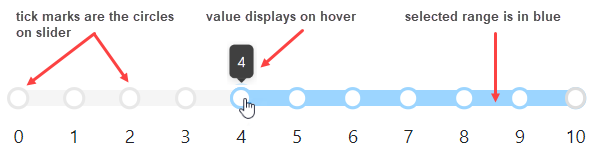
To interact with a slider:
- Click any tick mark to move the slider to that tick mark.
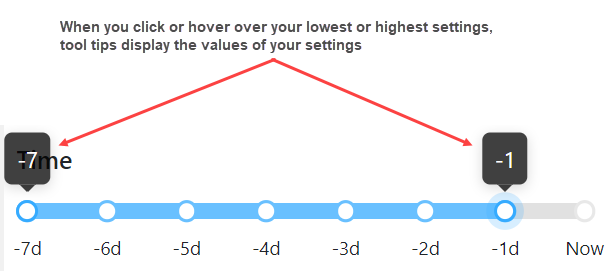
- Hover over the beginning or ending tick mark in your selected range to see a tooltip that displays the value of the beginning or end of your range.
Tooltips
To display tooltips, hover over a user interface element. For example:
-
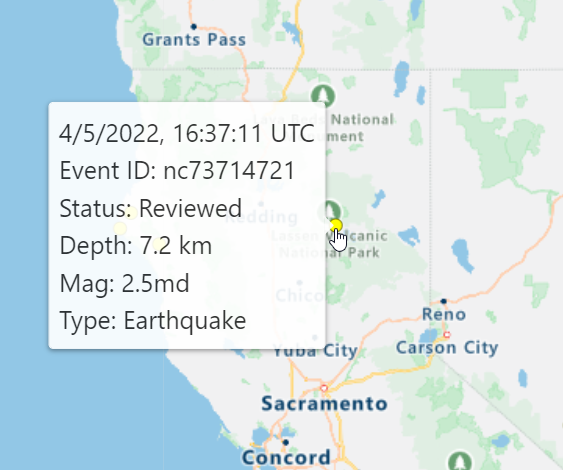
Hover over any earthquake on the map to get an Earthquake Summary tooltip that summarizes the earthquake (Figure 9).
Figure 9. Example of Event Summary Tooltip
- Hover over any icon (Figure 10), overlay (Figure 11 and Figure 12), and settings filter (Figure 13) to display a tooltip with their respective type, name, or value.
Figure 10. Example of Icon Tooltip
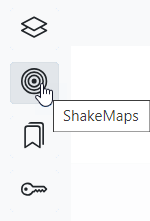
Figure 11. Example of Plate Boundary Overlay Tooltip
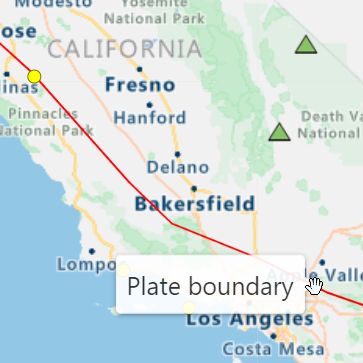
Figure 12. Example of US States Overlay Tooltip
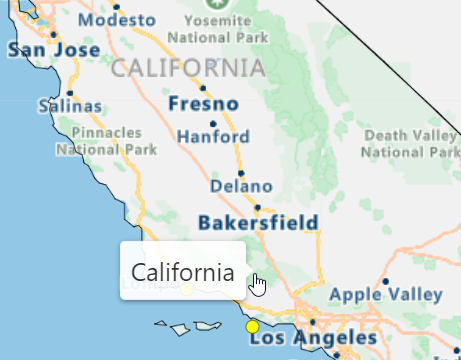
Figure 13. Example of Slider Tooltip in Settings
User Settings
How User Settings are Saved
QuakeMap uses cookies to automatically save your preferred application settings from your most recent work session.
|
| Using a single browser on a single machine will keep your settings forever unless you choose to erase them by pressing the Reset to Defaults button. However, if you switch browsers and open QuakeMap using a browser you don't typically use, you will have to set all of your preferences again. |
How to Reset to Default Settings
QuakeMap automatically saves the settings from your current or last application use. To restore the application’s defaults, open the Settings pane and click Restore to Defaults (Figure 14).
Figure 14. Restore to Defaults
Getting Started as an Authenticated User
This section of the user guide is for authenticated users only.
|
| If you are authorized to receive real-time notifications, ask your emergency response manager for your login credentials. |
Authenticated vs. Non-Authenticated Users
Authenticated users are typically emergency responders who must have immediate access to earthquake hazard information.
Authenticated users have additional access to the following:
Real-time data feed – PGA station updates in addition to the standard earthquake updates.
Real-time notifications – Real-time notifications about new earthquakes as they occur.
See New and Updated Events in the List and Real-Time Notifications to learn about the additional features provided to authenticated users.
How to Sign In and Out
To sign in as an authenticated user, navigate to the URL of the Sign-In page provided to you, enter your Username and Password, and click Sign in. When you sign in for the first time, or after clearing your cache or resetting your defaults, you are brought to QuakeMap’s default view, as shown in Layout. As described in How User Settings Are Saved, if your settings are saved, you will see the same view you saw when you ended your last work session.
To sign out as an authenticated user, click the Sign Out button at the bottom of the Settings pane.
Connection Status Indicator
Authenticated users’ screens display a connection status indicator in the form of a colored dot to the left of the menu (Figure 15). The color of the connection status indicator is green, yellow, or red, depending on the status of your connection, as described in Table 2.
Figure 15. Connection Status Indicator Location in User Interface
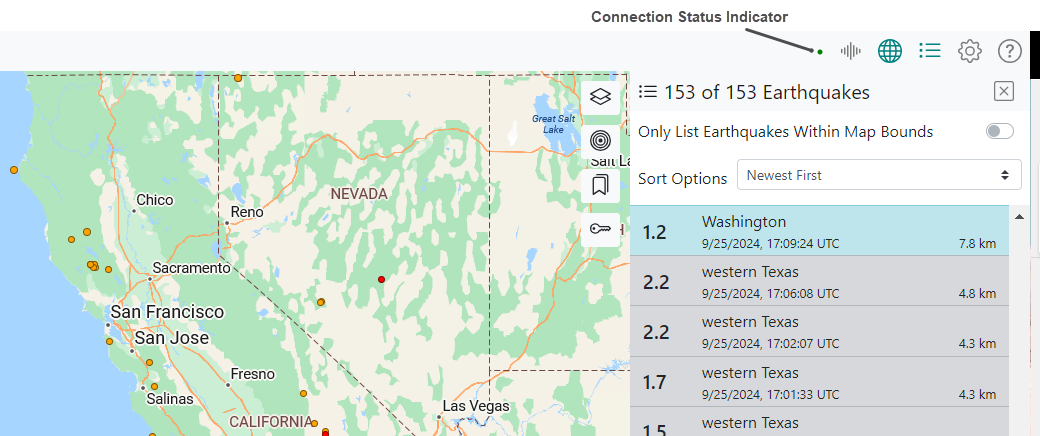
Table 2. Connection Status Indicator Colors
| Color | Example | Denotes |
|---|---|---|
| Red |  |
Disconnected |
| Yellow |  |
Connecting |
| Green |  |
Connected |
Map
Open the Map pane by clicking the Map icon  in the menu (Figure 16).
Figure 16. Map Pane
By default, QuakeMap shows earthquakes on the map as different shapes (Table 3), and each circle’s color depends on the corresponding magnitude and age (see Map Legend).
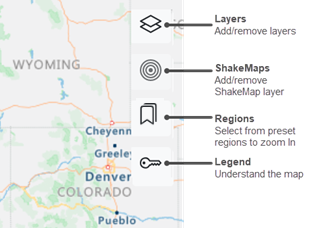
Map Icons
Each map icon has a specific functionality (Figure 17).
Figure 17. Map Icons
Map Markers
QuakeMap uses various markers on the map, as shown in Table 3.
|
| Table 3 includes all map markers, including ShakeMap-specific markers. For more information about ShakeMap-specific markers only, see Table 7. |
Table 3. Map Markers
| Marker | Denotes |
|---|---|
| Earthquake selected on the map; however, you can opt to display a selected earthquake in a cross or highlighted format (see Selected Decoration). | |
 |
Earthquake, if the Square Markers layer is enabled on the map |
| Volcano; color is based on alert level. | |
|
Seismic station; color is based on Peak Ground Acceleration (PGA) |
| ShakeMap seismic station | |
| ShakeMap Did You Feel It (DYFI) Station | |
 |
US Faults |
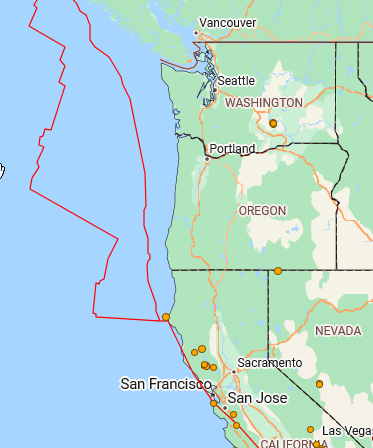 |
Plate Boundaries |
 |
US States |
| US Counties | |
 |
Labels/Roads – Labels such as road names, route numbers, airport names, state park names, etc. are displayed prominently on the map. |
 |
Traffic/Flow:
|
 |
Traffic/Incident:
|
|
Weather/Infrared |
 |
Weather/Radar |
 |
Classic Colors – if you select Classic Colors as a map layer, the color of earthquakes on the map changes from red, orange, and yellow (red < 1 hour, orange < 1 day, yellow < 1 week) to red, blue, and yellow (red < 1 hour, blue < 1 day, yellow < 1 week) |
Zoom
Use any of the following options to zoom in and out on the map (see also Zoom to Regions):
-
QuakeMap map controls
 . Click the plus sign to zoom in and the minus sign to zoom out.
 Double-click anywhere on the map; with each double-click on the map, the application zooms in closer
Keyboard plus and minus keys
Mouse scroll wheel
Map Interactions
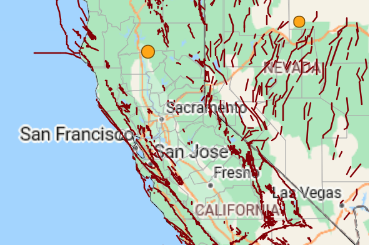
Zoom to Regions
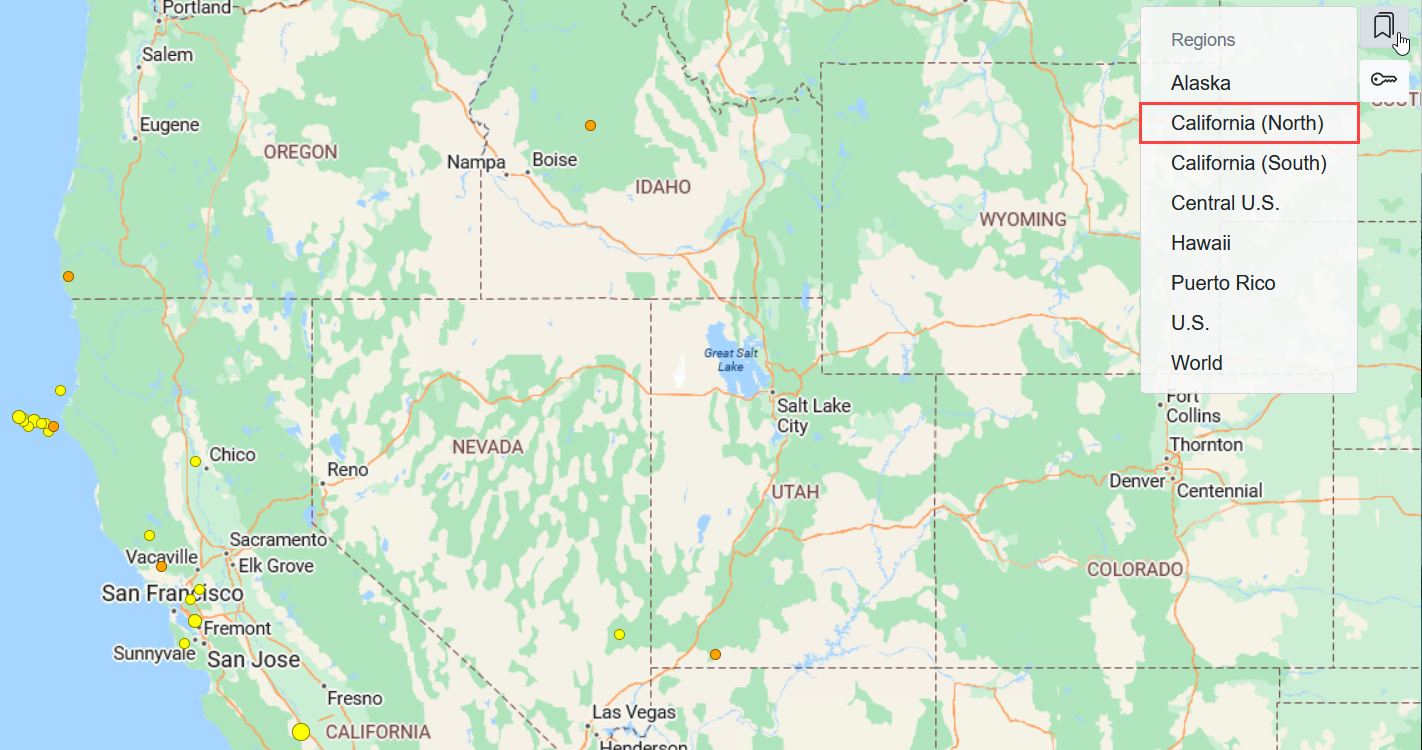
To zoom to specific, preset regions on the map:
Click the Regions icon
 .
.Select a region.
The map zooms to the selected region. Figure 18 shows the map with Northern California selected as the region.
Figure 18. Northern California Preset Region
Pan
Click and drag using your mouse to pan the map, or use shift+arrow keys (left, right, up, down).
Hover
Hover over various map elements to get the tooltips shown in Table 4.
Table 4. Map Tooltips Shown on Hover
| Map Element | Map Tooltip Shown on Hover |
|---|---|
| Event | Event Summary
|
| Overlay | Example of Plate Boundary overlay
|
| Overlay that shows US states or counties | Name of the state or county
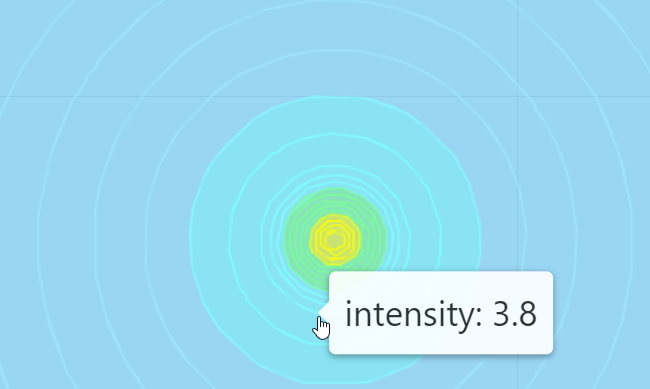
|
| ShakeMap | Hover over various areas of a ShakeMap to view intensity tooltips
|
| Station PGA | Hover over a station to view a Station PGA tooltip that shows, in this case, a station with a multi-colored triangle
|
Select an Earthquake
When you select an earthquake on the map, two things occur:
The map pans/zooms to the selected earthquake.
The Details pane opens and contains information about the selected earthquake. If the Details pane is already open when you select the earthquake, it updates to reflect the selected earthquake’s details.
Map Layers and Overlays
Add/Remove Map Layers and Overlays
To add or remove a Map layer or overlay:
-
Click the Layers icon
 (Figure 19).
Figure 19. Map Layers and Overlays Dropdown
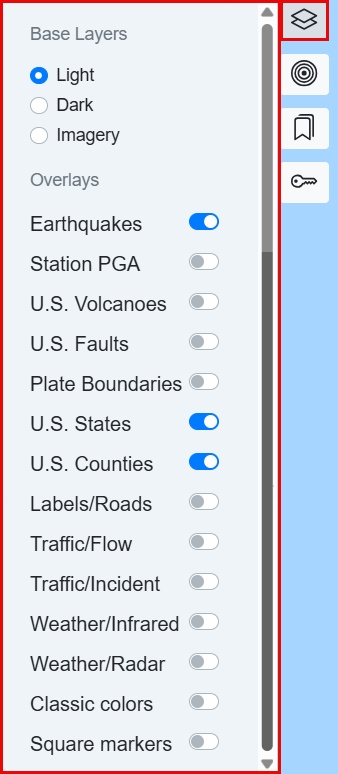
-
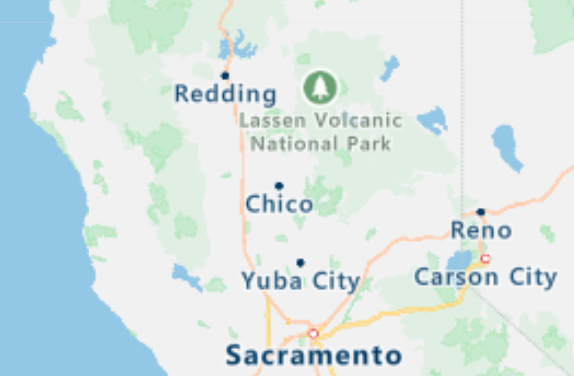
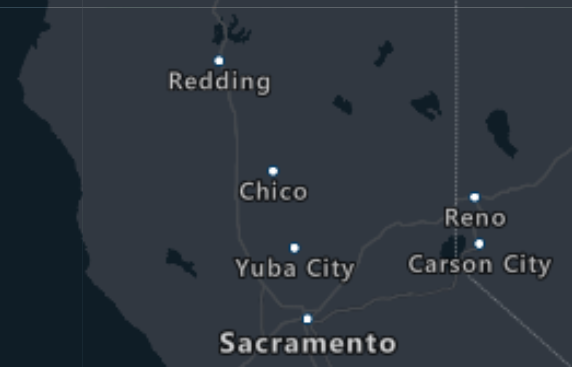
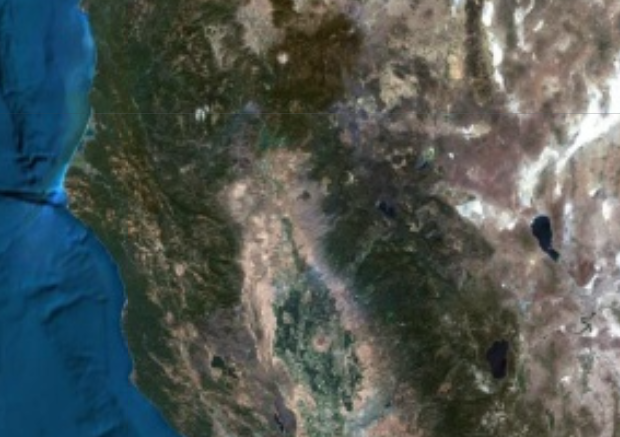
From the Layers dropdown, toggle on or off a base layer: light, dark, or imagery (Table 5). You can choose only one base layer at a time.
Table 5. Map Base Layers
| Base Layer Selection | Denotes |
|---|---|
| Light (default) | A light style is applied to all layers.
|
| Dark | A dark, charcoal style is applied to all layers.
|
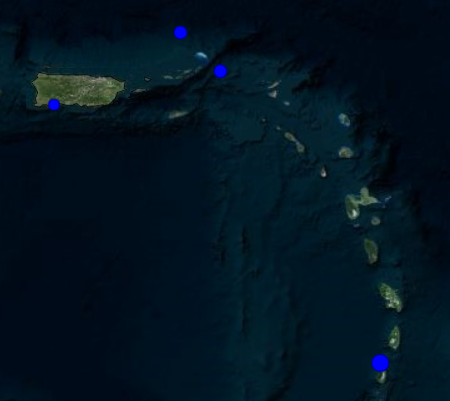
| Imagery | A combination of satellite and aerial imagery is applied to all layers.
|
Toggle on or off one or more of the following overlays (Table 6).
Table 6. Map Overlays
| Overlay | Denotes |
|---|---|
| Earthquakes (on by default) |
The earthquake catalog, sourced from the ANSS Comprehensive Earthquake Catalog, is provided to QuakeMap end users courtesy of the partnership between CalOES and CGS. |
| Station PGA | Displays stations along with their Peak Ground Acceleration (PGA) on the map and in the list (available to authenticated users only). |
| US Volcanoes | Volcano status, courtesy of USGS. |
| US Faults | California and Nevada faults. |
| Plate Boundaries | Global plate boundaries. |
| US States (on by default) |
US state boundaries from 2010 census data; 5m resolution. |
| US Counties (on by default) |
US county boundaries from 2010 census data; 5m resolution. |
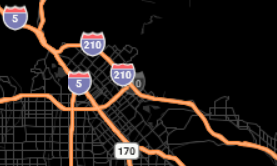
| Labels/Roads | Road, boundary, and label data. |
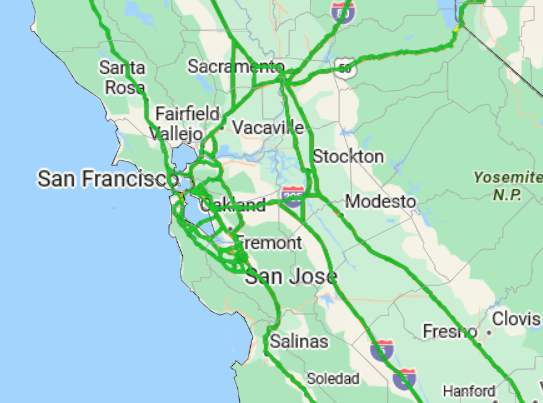
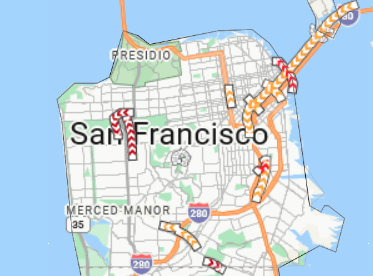
| Traffic/Flow | Colors reflect the speed relative to free flow, highlighting areas of congestion and visualizing the traffic flow (free flow refers to conditions with no congestion, and traffic can follow the speed limits). |
| Traffic/Incident | Creates traffic lines with colored chevrons indicating the severity. |
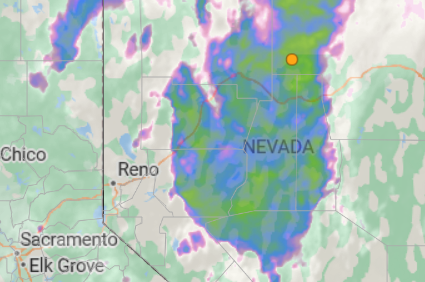
| Weather/Infrared | Latest Infrared Satellite images show clouds by their temperatures. |
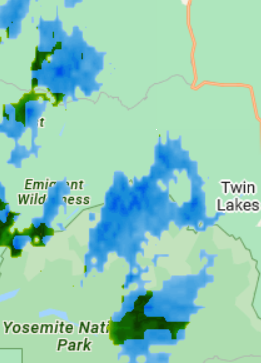
| Weather/Radar | Weather radar tiles and the latest weather radar images, which include areas of rain, snow, ice, and mixed conditions. |
| Classic Colors | Red, blue, and yellow are classic colors; therefore, if you select Classic Colors as a map layer, the color of earthquakes on the map changes from red, orange, and yellow (red < 1 hour, orange < 1 day, yellow < 1 week) to red, blue, and yellow (red < 1 hour, blue < 1 day, yellow < 1 week). |
| Square Markers | Changes earthquake markers from circles to squares. |
|
| US States and Counties are turned on by default. When both of these overlays are turned on simultaneously when you hover over the map, the tooltip displayed will always be for a county. If US Counties are turned off but US States are turned on when you hover over the map, the tooltip displayed will be for a state. |
ShakeMaps
ShakeMap Station Markers
QuakeMap shows ShakeMap stations on the map as diamonds or pentagrams, depending on the station type (Table 7).
Table 7. ShakeMap Station Symbols
| Symbol | Denotes |
|---|---|
| ShakeMap Seismic Station: color is based on ShakeMap intensity. | |
| ShakeMap Did You Feel It (DYFI) Station: color is based on ShakeMap intensity. |
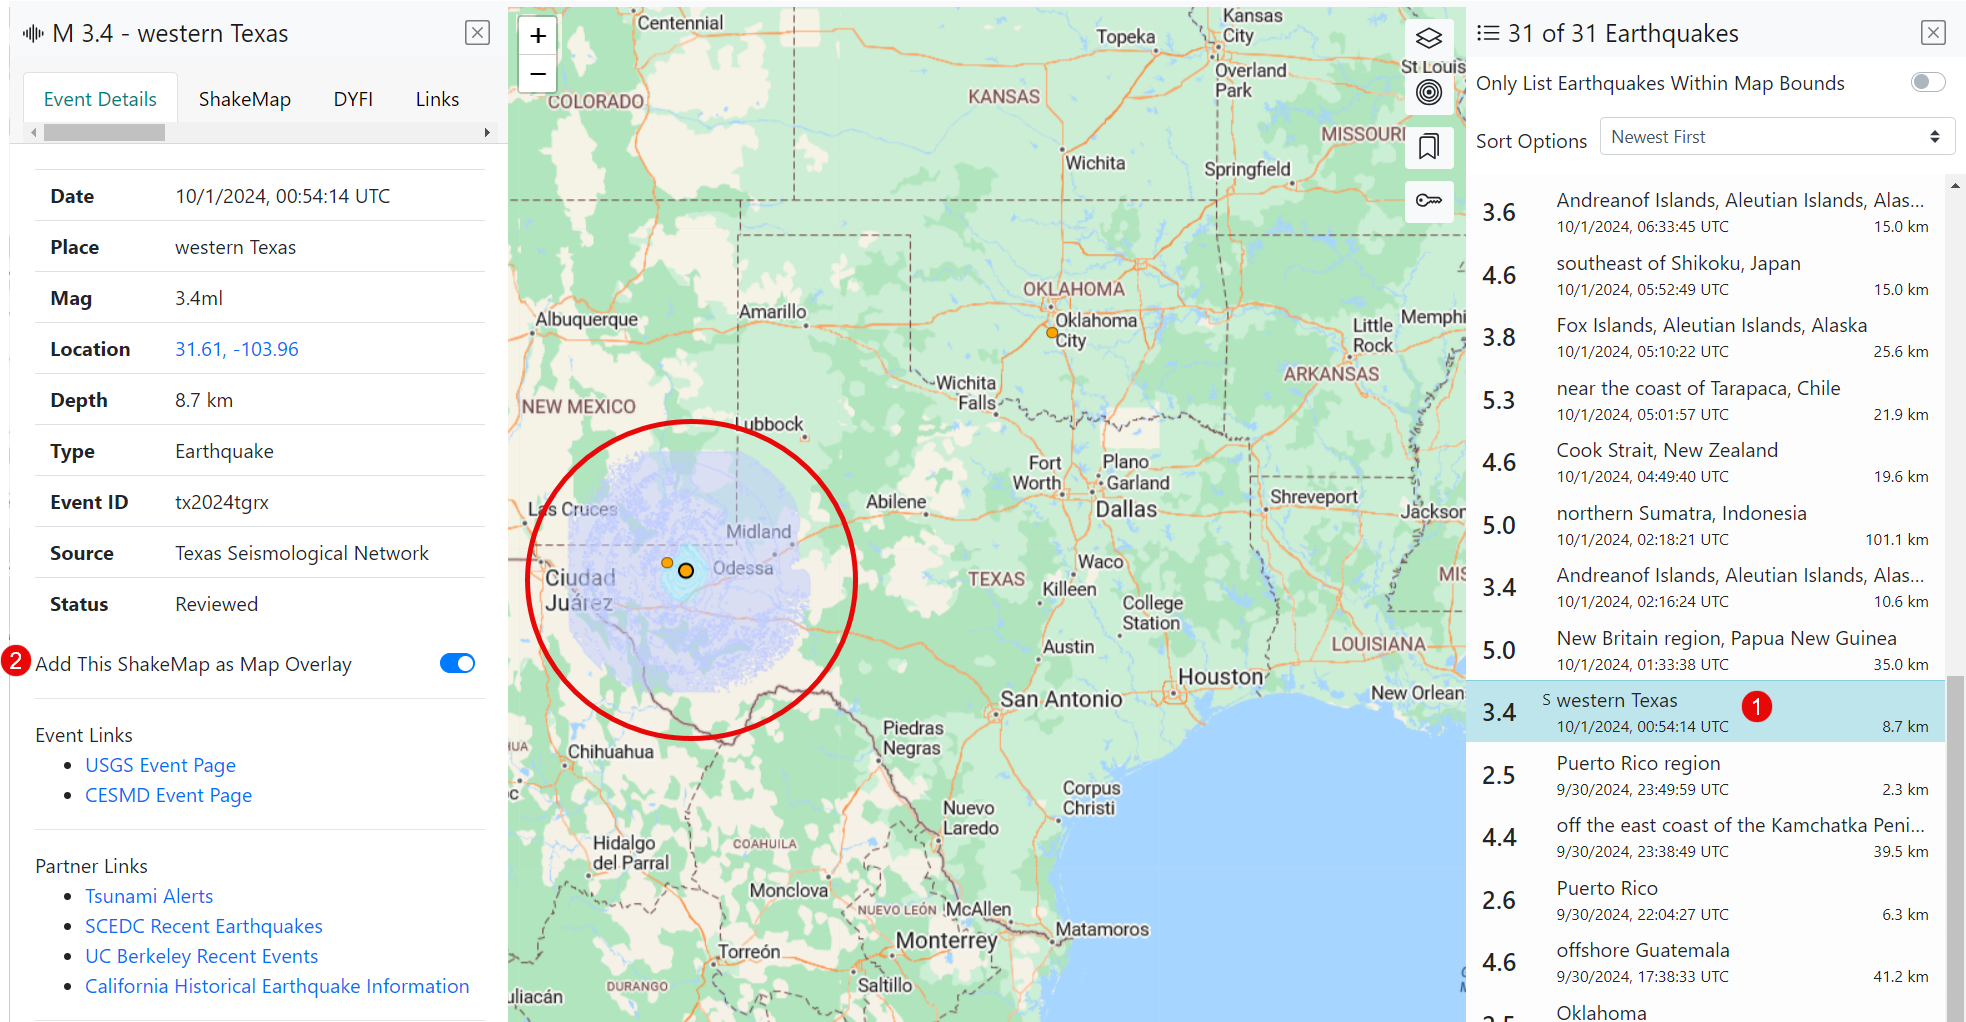
Add ShakeMap as Map Overlay
To add a ShakeMap overlay to the map:
Click an earthquake in the list that displays the “S” symbol. The application will zoom to the earthquake on the map, and simultaneously, it will open the Details pane if it was closed or, if it is already open, it will update it to reflect the details of the earthquake you just clicked.
Turn on the Add This ShakeMap as Map Overlay toggle switch on the Event Details tab. The ShakeMap appears on the map encircled in red (Figure 20).
Figure 20. ShakeMap Overlay
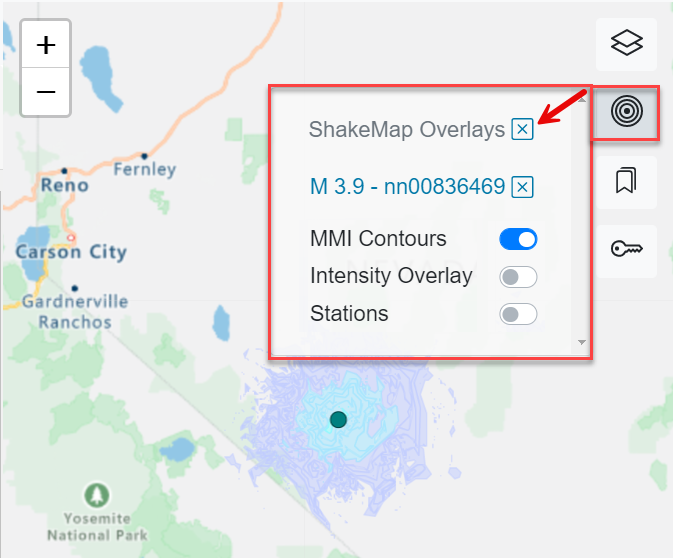
Configure a ShakeMap Overlay
You can configure a ShakeMap overlay you have already added to the map:
Click the ShakeMaps icon
 to bring up the ShakeMap Overlays dropdown (Figure 21).
Figure 21. ShakeMap Overlays Dropdown
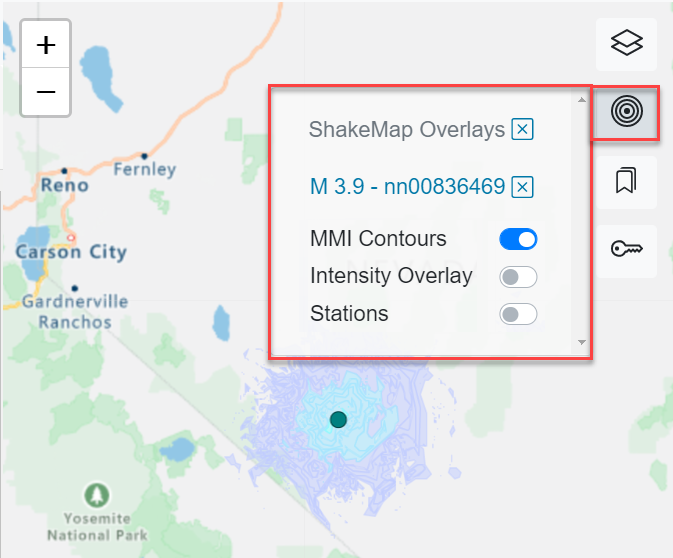
Toggle on or off any of the desired options described in Table 8.
Table 8. Definition of ShakeMap Overlays
| ShakeMap Overlay | Denotes |
|---|---|
| Modified Mercalli Intensity (MMI) Contours (default) | Shows contour polygons of the peak macroseismic intensity (usually, but not necessarily, MMI) in intervals of 0.2 intensity units |
| Intensity Overlay | Shows macroseismic intensity (usually, but not necessarily, mmi) from a PNG overlay file, with the accompanying world file used for georeferencing |
| Stations | Adds to the map any stations located in the area of the ShakeMap |
Add and Configure Multiple ShakeMap Overlays
To add additional ShakeMap overlays in addition to any currently displayed on the map:
Click another earthquake in the list that displays the “S” symbol. The application will zoom to the earthquake on the map, and simultaneously, it will open the Details pane if it was closed or, if it is already open, it will update it to reflect the details of the earthquake you just clicked.
Toggle on Add This ShakeMap as Map Overlay on the Event Details tab. The ShakeMap appears on the map (Figure 20).
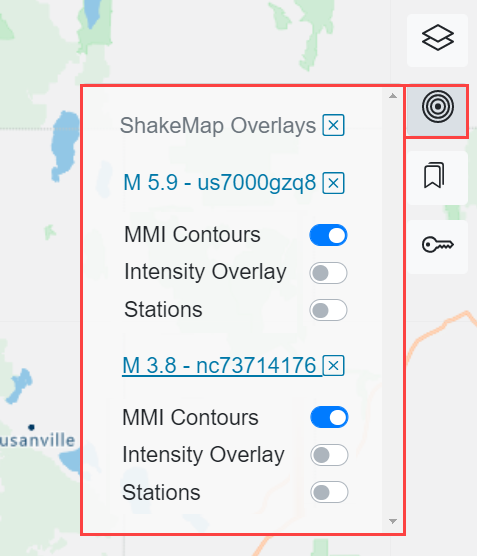
Click the ShakeMaps icon
to configure the ShakeMap layer you’ve added to the map. Note that all the ShakeMap overlays you have added to the map are reflected in the ShakeMap Overlays dropdown (Figure 22).Toggle on or off any of the ShakeMap overlays displayed in the dropdown (Figure 22).
Figure 22. ShakeMap Overlays Dropdown with Multiple ShakeMap Overlays
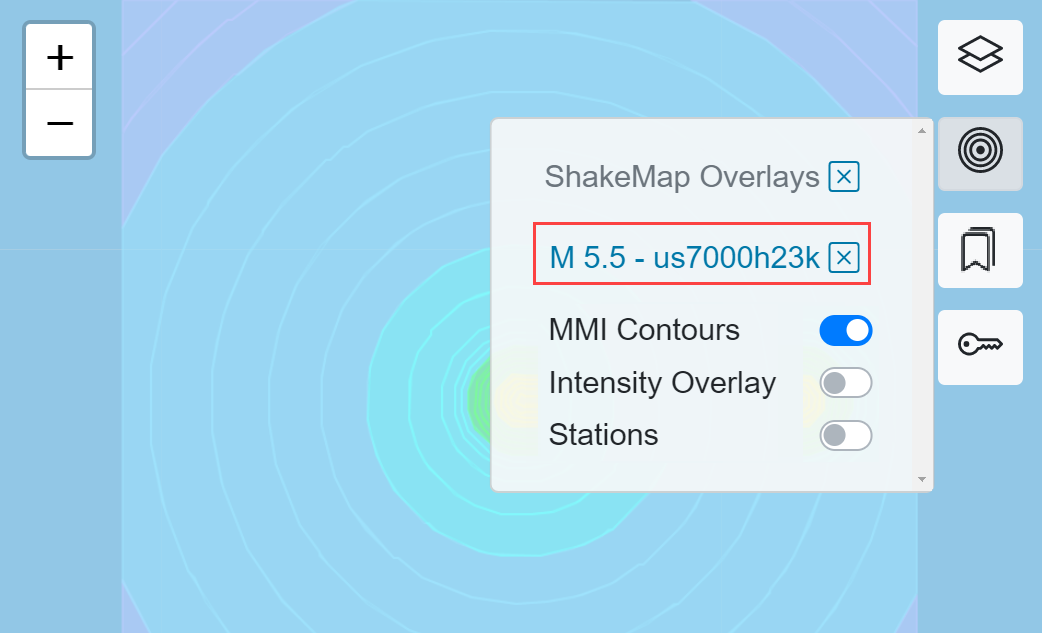
Click a ShakeMap Event
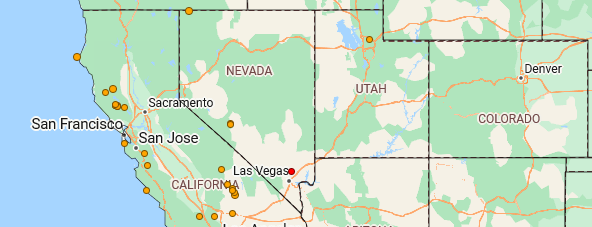
When you click an earthquake in the ShakeMap Overlays dropdown, the map pans/zooms to the earthquake (Figure 23).
Figure 23. Clicked Earthquake in ShakeMap Overlay Causes Map to Pan/Zoom to Event
Remove a ShakeMap Overlay from the Map
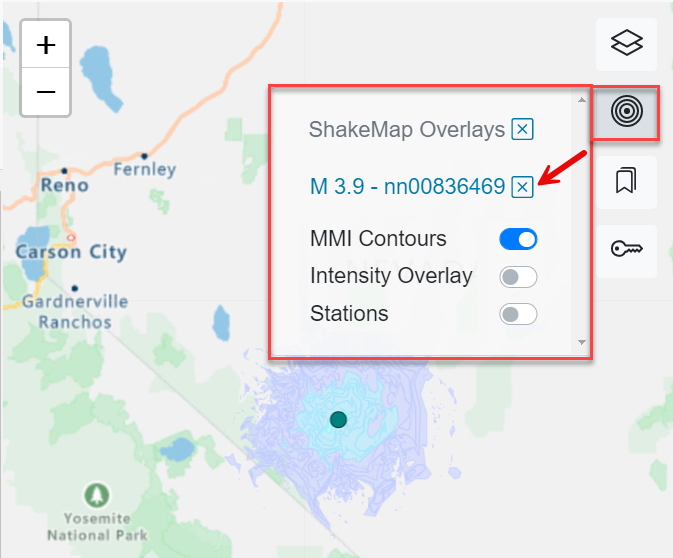
To remove a ShakeMap overlay from the map, from the ShakeMap Overlays dropdown, click  next to the ShakeMap overlay you wish to remove (Figure 24).
Figure 24. Remove a ShakeMap Overlay
To remove all ShakeMap overlays from the map, from the ShakeMap Overlays dropdown, click next to ShakeMap overlays (Figure 25).
Figure 25. Remove all ShakeMap Overlays
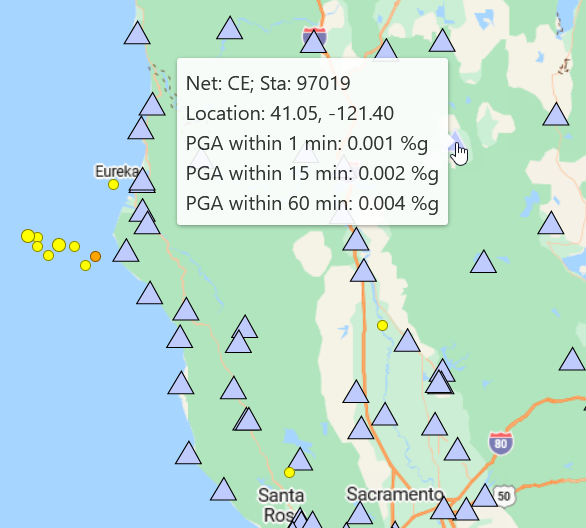
Station PGA on the Map – For Authenticated Users Only
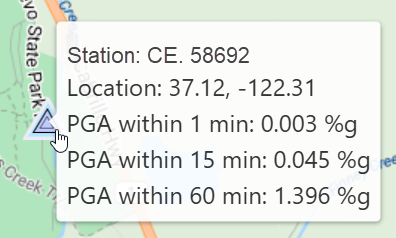
The server uses real-time Station Peak Ground Acceleration (PGA) data to create a report and send it to QuakeMap for display. The report contains three values for each station: the 1m, 15m, and 60m averages; each of these averages is referred to as a PGA window. See Set a PGA window.
Authenticated users can see the PGA stations on the map. The station PGA icon colors depict the PGA window(s) (see Station PGA in the Legend to understand PGA station colors), while the tooltip contains the PGA window values in addition to other details (Figure 26). Click a station on the map to highlight the station in the Station PGA list (see Station PGA List).
Figure 26. Station PGA on the Map
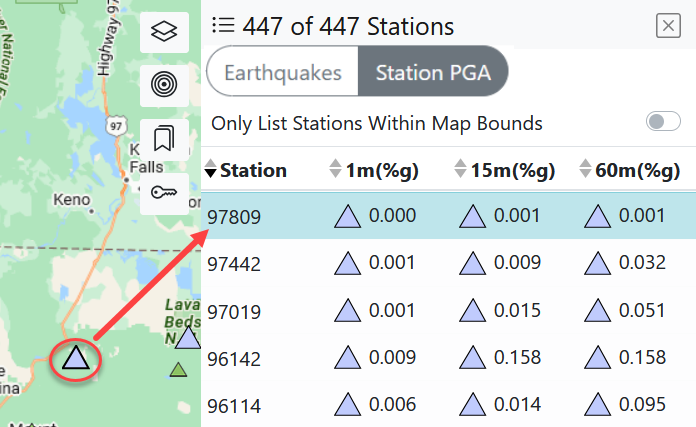
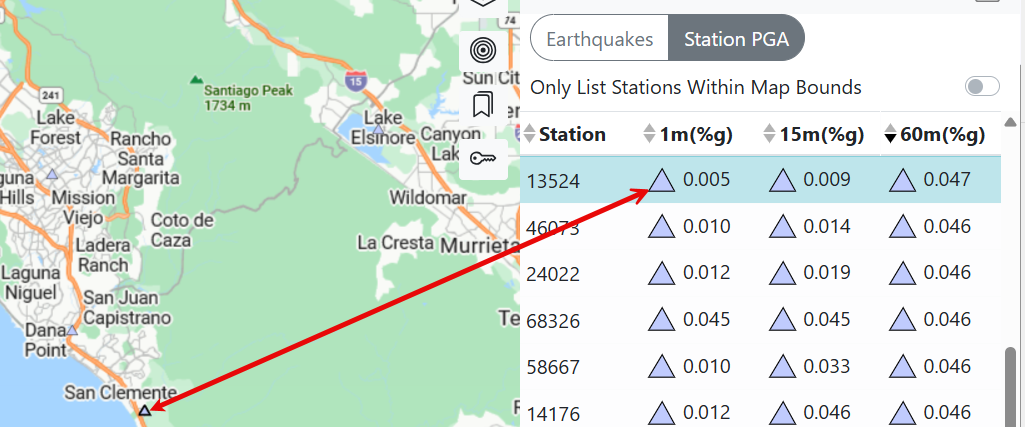
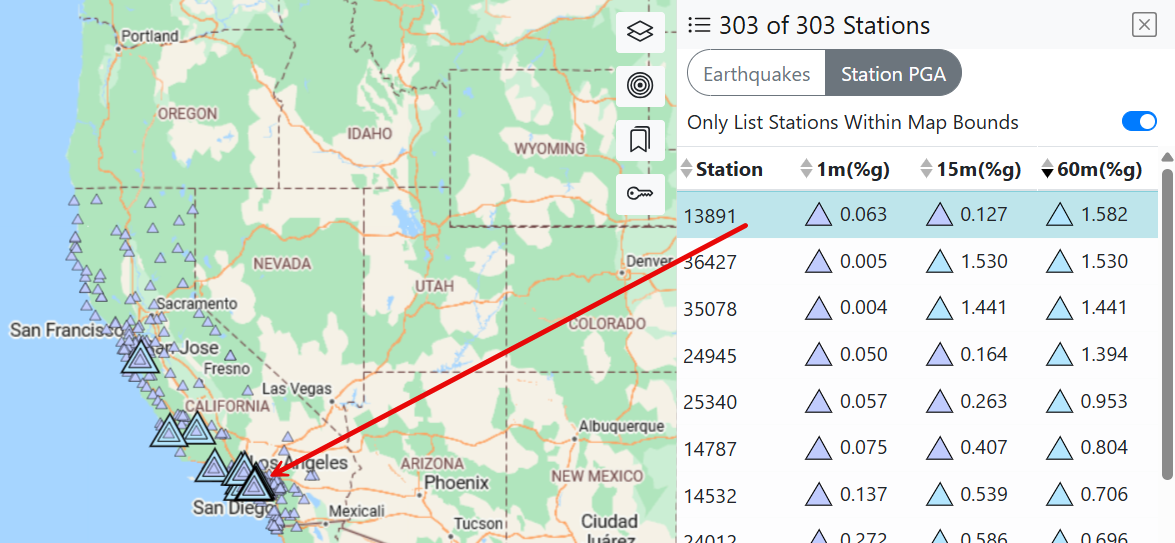
Click a Station on the Map
When you click a station on the map, the corresponding station is highlighted in turquoise in the Station PGA list (Figure 27).
Figure 27. Station Selected on Map Highlighted in Station PGA List
Map Legend
To view the map legend, click the Legend icon  .
.
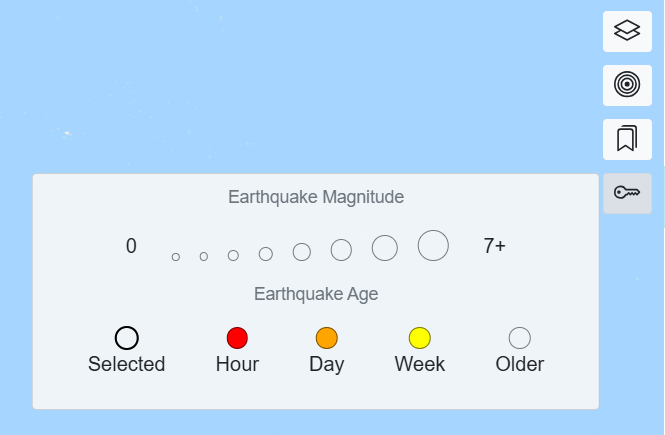
Map Legend
Figure 28 shows the default view of the map legend, consisting of information about earthquake magnitude and age, as well as overlays.
Figure 28. Default Map Legend
Adaptability of Map Legend
Layers, ShakeMap, Station PGA, and other features appear in the map legend when you enable them in the map. For example, if you add a ShakeMap overlay to the map, the legend automatically shows ShakeMap-related features (Figure 29).
Figure 29. Map Legend Showing ShakeMap Intensity
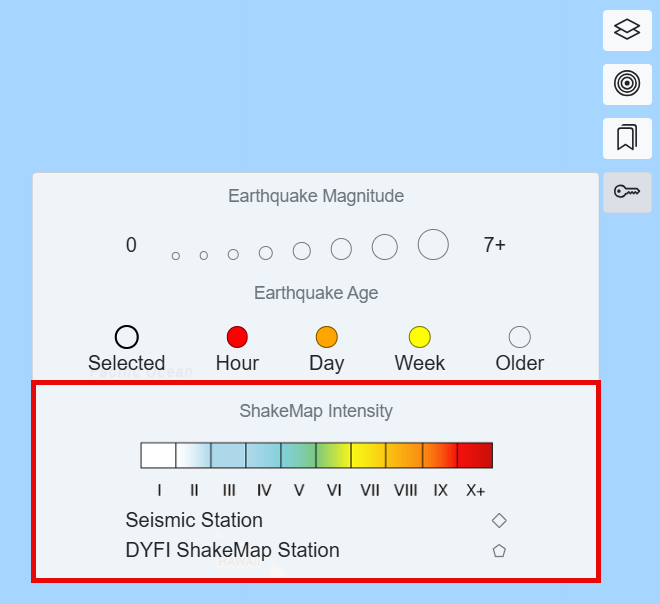
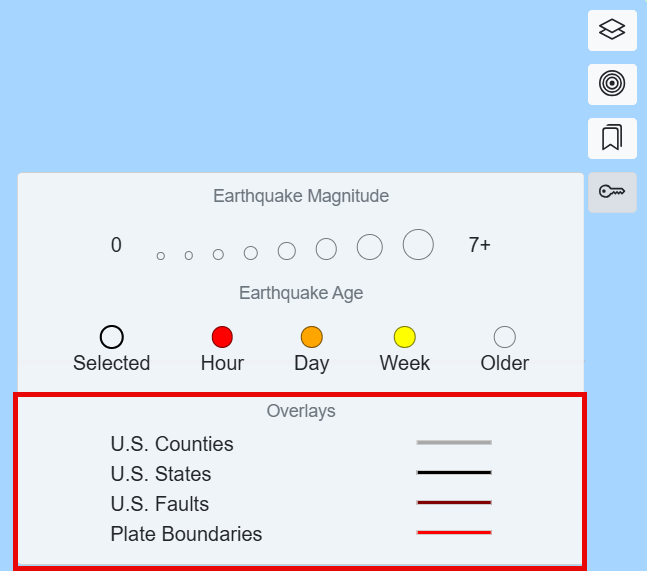
Figure 30 shows the legend when the counties layer is turned on.
Figure 30. Map Legend Showing Counties
Station PGA in the Legend – For Authenticated Users Only
If you are an authenticated user, the legend will show information about Station PGA values (Figure 31).
Also shown in Figure 31, the station icon color corresponds to the station PGA; e.g., a light orange triangle denotes a station’s PGA as greater than or equal to 18%g.
Figure 31. Map Legend Showing Station PGA
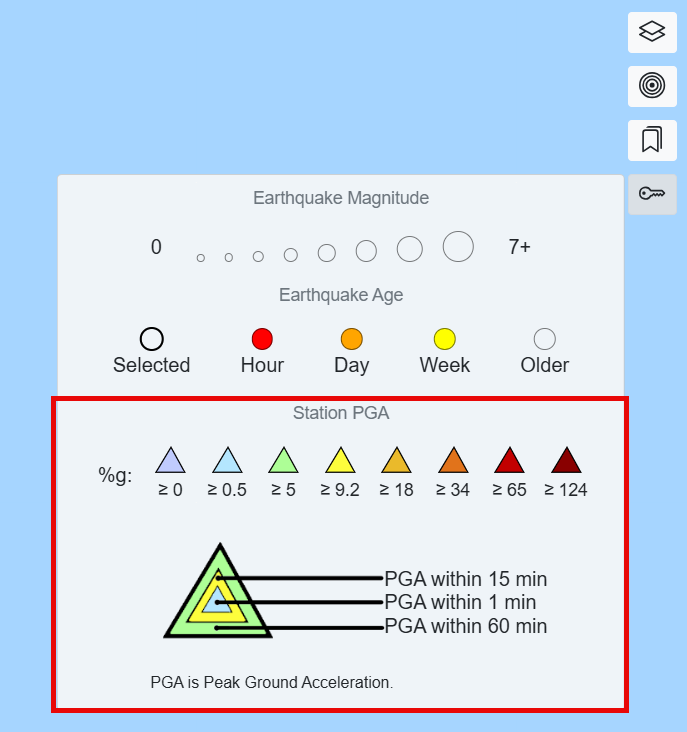
If the station PGAs for the three time windows are in one range, then the station PGA is represented on the map and in the list as a single-colored triangle, with the color representing the range. In Figure 32, the color of the selected station in the map and list correlates to ≥ 0%g in the legend.
Figure 32. Station as Triangle with PGAs in Same Time Window
If the station PGAs for the three time windows are in more than one range, then the station PGA is represented on the map and in the list as a multi-colored triangle, with each color representing the respective range (Figure 33).
Figure 33. Station as Multi-Colored Triangle with PGAs in More than One Time Window
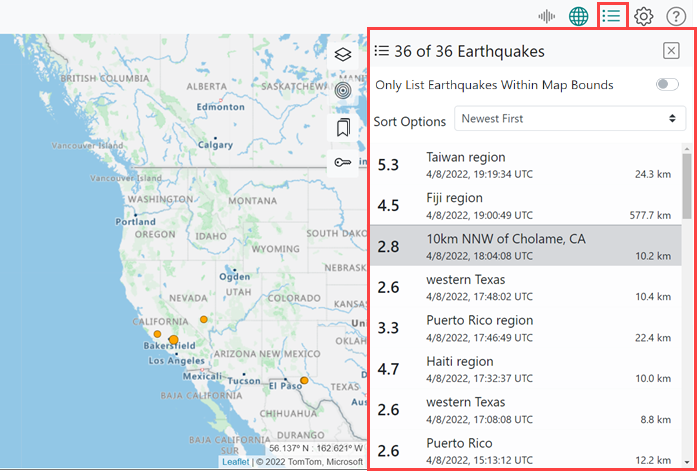
List
The List pane brings up a list of earthquakes. To view the List pane, click the List icon  in the menu (Figure 34).
Figure 34. List Pane
List Elements
Figure 35 and Table 9 show and describe the List pane’s elements.
Figure 35. List Pane Elements
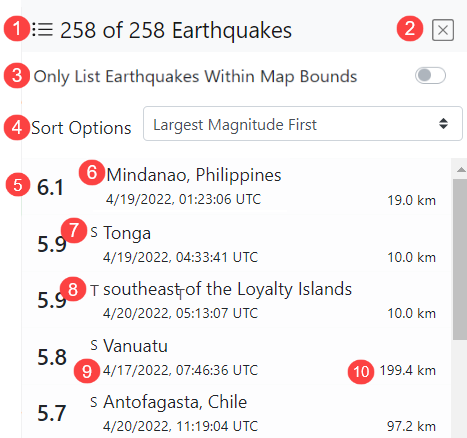
Table 9. Description of List Pane Elements
| Ref. No. | List Element | Description |
|---|---|---|
| 1 | x of y Earthquakes | Where: x is the number of earthquakes shown in the list x value is based on the checkbox Only List Earthquakes Within Map Bounds. y value is based on your magnitude and time filter settings (Settings). |
| 2 | X | Close the list |
| 3 | Only List Earthquakes Within Map Bounds | By default, this element is turned on. Toggle on – the list filters on visible map bounds and your magnitude and time filter settings. Toggle off – the list filters only on your magnitude and time filter settings. |
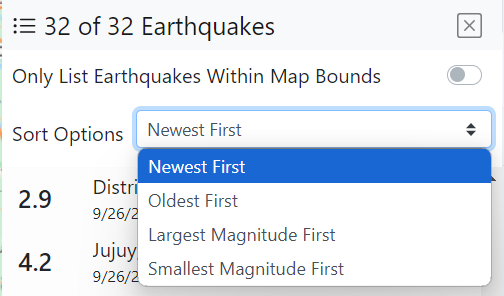
| 4 | Sort Options | Newest First (default), Oldest First, Largest Magnitude First, and Smallest Magnitude First. |
| 5 | Magnitude | Measure of the size of the earthquake at its source. |
| 6 | Place | Distance from the nearest city. |
| 7 | S | ShakeMap is available for this earthquake. |
| 8 | T | A tsunami notification was generated for this earthquake. |
| 9 | Date and Time | Date and time of the earthquake. |
| 10 | Depth | Depth where the earthquake begins to rupture. |
List Colors
The earthquakes displayed in the list can have five distinct colors: white, gray, lavender, and turquoise. Table 10 lists the colors, shows an example of each color, and describes what each color means.
Table 10. List Colors
| Color of Event in List Pane | Example of Color | Denotes |
|---|---|---|
| White | 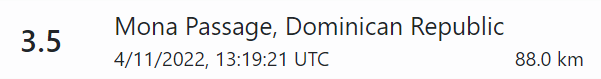 |
Reviewed (by a human). |
| Gray | 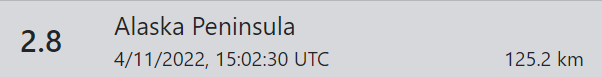 |
Automatic (not reviewed by a human). |
| Turquoise | 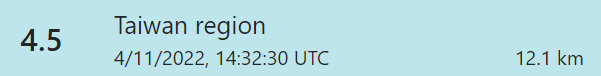 |
You selected/clicked this earthquake. |
|
| When you hover over any earthquake in the list, it turns a darker shade of its color; e.g., if it is currently gray, it will turn a darker gray when you hover over it. |
List Sort Options
To sort the list, select one of the four options from the dropdown shown in Figure 36.
Figure 36. List Sort Options
Select an Earthquake from the List
When you select an earthquake from the list, two things occur:
The Map pans/zooms to the selected earthquake.
The Details pane opens with about the selected earthquake. If the Details pane is already open when you select the earthquake, it updates to reflect the selected earthquake’s details.
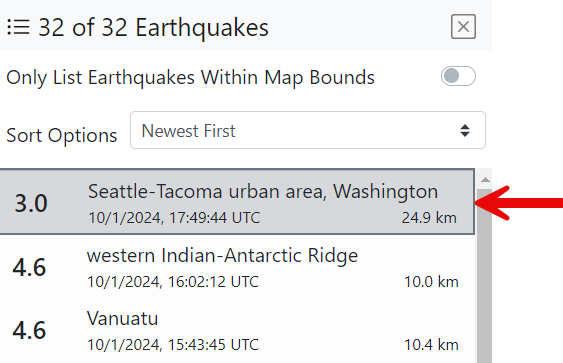
New and Updated Events in the List – For Authenticated Users Only
|
| This section of the user guide is for authenticated users only. Typically, authenticated users are Emergency Responders who must have immediate access to earthquake hazard information. |
Authenticated users see an additional feature in the list: new earthquakes have a dark square border around them. Figure 37 shows a gray-colored earthquake (signifying an automatic earthquake) with a dark border (signifying a new earthquake).
Figure 37. Example of New Earthquakes in List with Dark Square Border
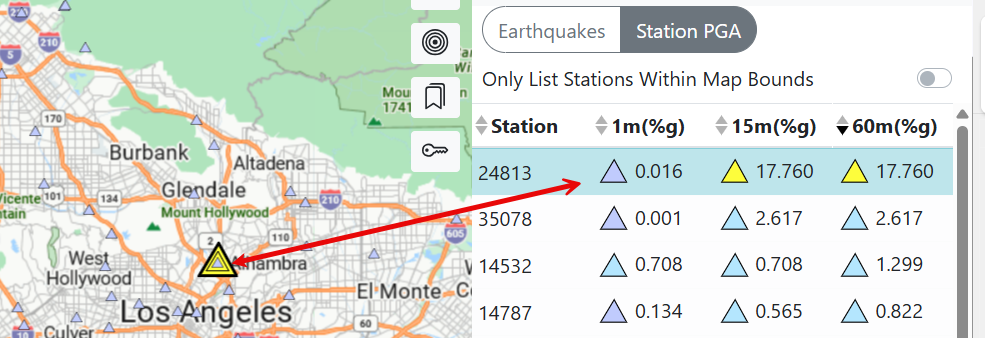
Station PGA List – For Authenticated Users Only
Authenticated users can view and toggle between two lists: Earthquakes and Station PGA. As with the basic list, authenticated users can toggle on or off the Only List Stations Within Map Bounds switch at the top of the list.
Station PGA List Elements
Figure 38 and Table 11 show and describe the Station PGA List pane’s elements.
Figure 38. Station PGA List Elements
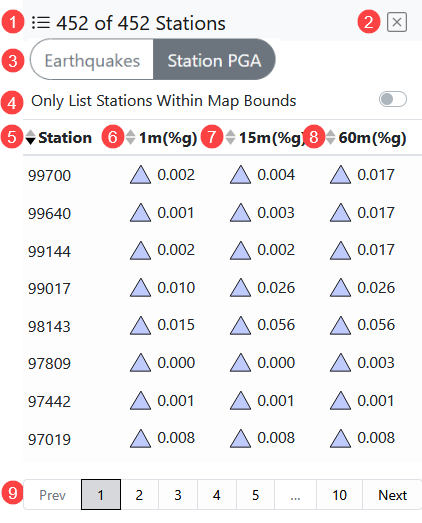
Table 11. Description of Station PGA List Pane Elements
| Ref. No. | List Element | Description |
|---|---|---|
| 1 | x of y Stations | Where: x is the number of stations shown in the list x value is based on the checkbox Only List Stations Within Map Bounds. y value is based on your magnitude and time filter settings (see Settings). |
| 2 | X | Close the list |
| 3 | Earthquakes/Station PGA Toggle | Toggle between the Earthquakes and Station PGA lists. |
| 4 | Only List Stations Within Map Bounds | By default, this element is turned on. Toggle on – the list filters on visible map bounds and your magnitude and time filter settings. Toggle off – the list filters only on your magnitude and time filter settings. |
| 5 | Station | Station Name. |
| 6 | 1m (%g) | One minute PGA average. |
| 7 | 15m (%g) | Fifteen minutes PGA average. |
| 8 | 60m (%g) | Sixty minutes PGA average. |
| 9 | List Pagination | Navigate through the pages in a multi-page list. |
Station PGA List Colors
Each row of stations displayed in the Station PGA list is highlighted with one of three distinct colors: white, lavender, and turquoise. Table 12 shows an example of each color and describes what each color means.
See Station PGA in Legend to learn about the multi-colored station triangles, which represent PGAs in more than one time window.
Table 12. Station PGA List Colors
| Color of Station Information in List Pane |
Example of Color | Denotes |
|---|---|---|
| White |  |
The station as it looks in the list without any special actions taken by the user. |
| Gray |  |
Your cursor is hovering over the station row. |
| Turquoise |  |
You selected this station on the map or in the list. |
|
When you hover over any station in the list, it turns a darker shade of its color; e.g., if it is currently turquoise, it will turn a darker turquoise when you hover over it. |
Select a Station from the List
When you select a station from the list, the Map pans/zooms to the selected station, and the station triangle’s black border becomes bold (Figure 39).
Figure 39. Station on Map When Selected from the List
Details
To view comprehensive details about an earthquake, click an earthquake on the map or in the list; this opens the Details pane for the selected earthquake (Figure 40).
|
You can also click the Details icon  in the menu to open it; however, if you click the Details icon in the menu without first selecting an earthquake on either the map or the list, the application will tell you that no earthquake has been selected. in the menu to open it; however, if you click the Details icon in the menu without first selecting an earthquake on either the map or the list, the application will tell you that no earthquake has been selected. |
Figure 40. Details Pane
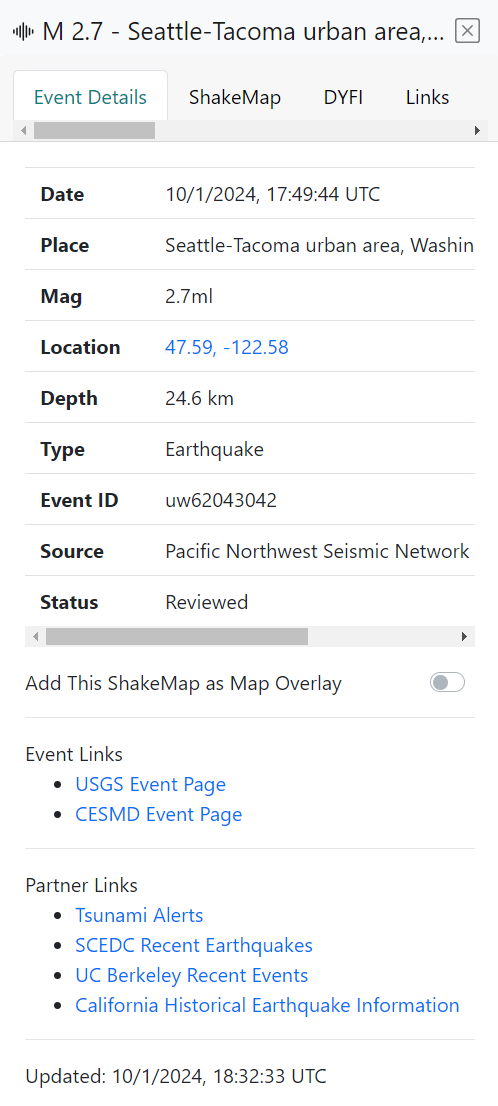
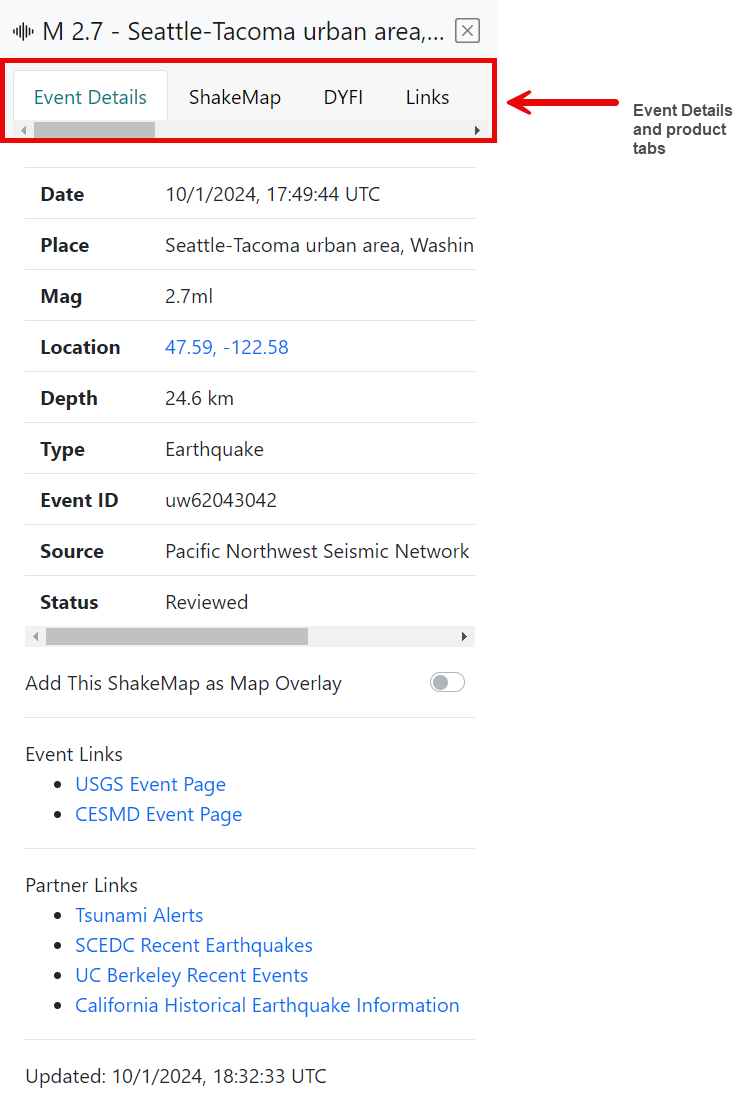
Event Details Tab
The Event Details tab provides all earthquake details. Figure 41 and Table 13 show and describe the Event Detail tab’s elements.
Figure 41. Event Details Tab
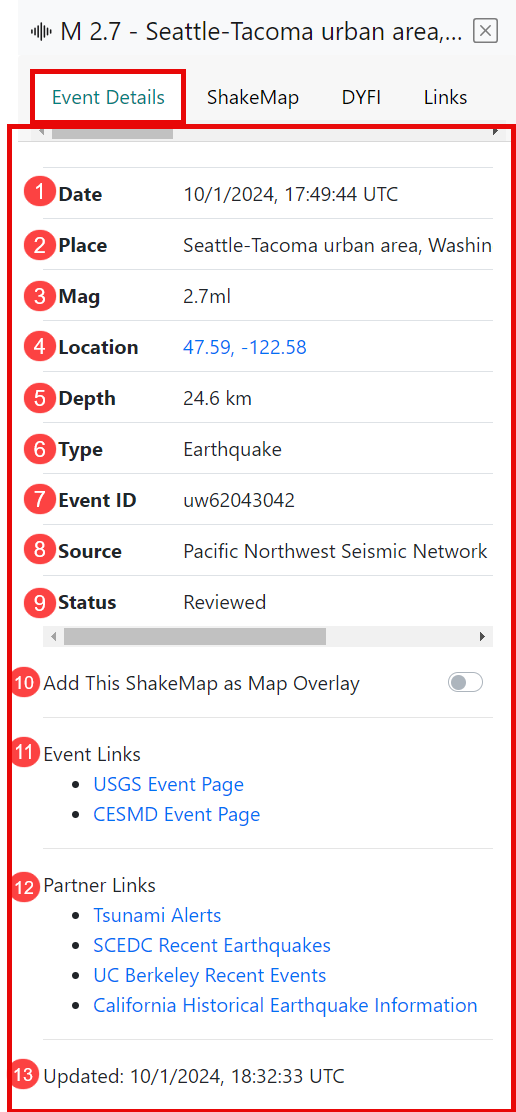
Table 13. Description of Event Detail Tab Elements
| Ref. No. | Event Detail | Description |
|---|---|---|
| 1 | Date | Date the earthquake occurred. |
| 2 | Place | Distance from the nearest city. |
| 3 | Mag | Measure of the size of an earthquake at its source. |
| 4 | Location | Latitude and Longitude (click to zoom to earthquake). |
| 5 | Depth | Depth where the earthquake begins to rupture. |
| 6 | Type | Type of seismic event, e.g., earthquake, quarry. |
| 7 | Event ID | ID assigned to the event by the authoritative seismic network. |
| 8 | Source | Name of the authoritative seismic network that is the source of the event information. |
| 9 | Status | Either Automatic (not reviewed yet) or Reviewed (by a human). |
| 10 | Add This ShakeMap as Map Overlay | When a ShakeMap event is selected, toggle on or off to add it as a map overlay. Note that if a non-ShakeMap event is selected, this toggle is disabled. |
| 11 | Event Links | Links to other pages with information about this event, e.g., USGS Event Page. |
| 12 | Partner Links | Links to various partners’ pages, e.g., you can click Tsunami Alerts to go to NOAA’s US Tsunami Warning System page. |
| 13 | Updated Date and Time | The date and time of the last update to this event information. |
|
If you select an Event Details tab and see only N/A, such data is not available for the event. |
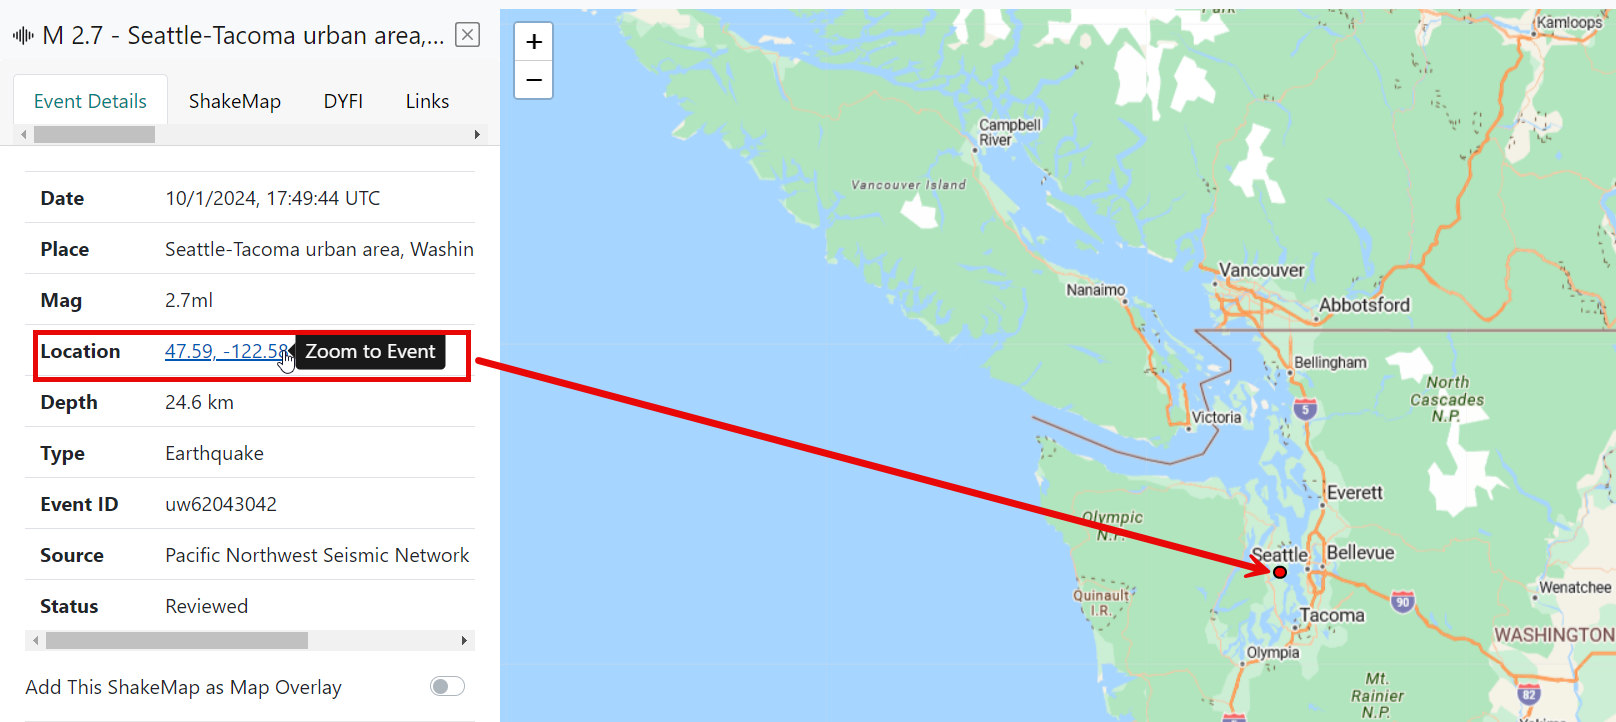
Click Lat/Lon
When you click the Lat/Lon coordinates on the Event Details tab, the map zooms to the event that corresponds to the lat/lon (Figure 42).
Figure 42. Click Lat/Lon to Zoom to Event
Product Tabs
The Details pane contains a tab for each of the available products for an event, such as ShakeMap, DYFI, and more. Each product has a tab in the Details pane (Figure 43).
Figure 43. Product Tabs
Product tabs help you automatically associate specific earthquakes to products and services produced by CISN member organizations located on the Web. Products are specific versions of any content produced in response to an earthquake, information about an earthquake, or another product. A product typically consists of a directory of files but may also include a stream of bytes, links to internet resources, and key/value pairs.
(Figure 44)shows an example event’s DYFI product tab.
Figure 44. Example Product Tab: DYFI
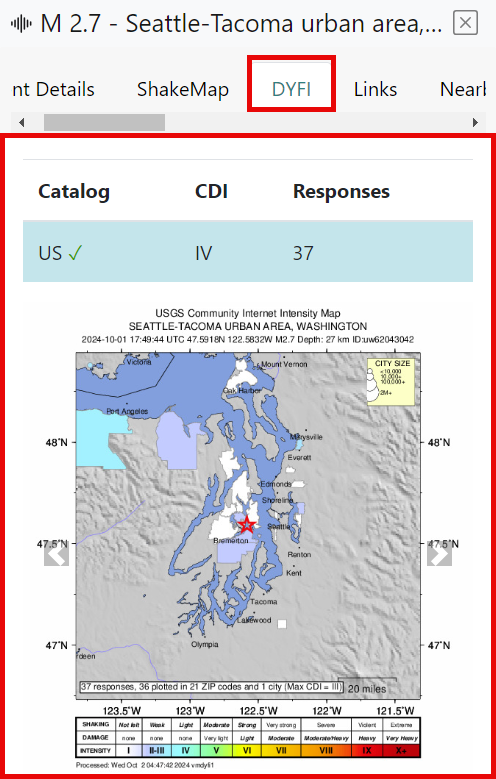
Table 14 describes all products that QuakeMap may potentially display for events.
Table 14. Event Product Descriptions
| Product | Description |
|---|---|
| ShakeMap | Near-real-time maps of ground motion and shaking intensity following significant earthquakes. |
| Did You Feel It (DYFI)? | The collection of information from people who felt an earthquake results in maps that show what people experienced and the extent of damage. |
| Links | Links to tsunami warnings or additional waveforms; however, there could be other types of links, and it is up to the sender (regional seismic network, tsunami warning center, etc.) to decide what links to send out. |
| Nearby Cities | Data about cities near the event. |
| Focal-mechanism | Graphic symbol that visually represents the style of faulting (focal mechanism) derived from the estimated moment tensor. |
| Ground Failure | Near-real-time spatial estimates of earthquake-triggered landslides and liquefaction hazards following significant earthquakes worldwide. |
| Moment Tensor | Mathematical representation of the movement on a fault during an earthquake. |
| OAF | Operational Aftershock Forecasting is an important post-earthquake scientific response to reduce seismic risks after a main shock. |
| Origin | The date and time when the earthquake initiates rupture is known as the “origin” time. |
| PAGER | Fatality and economic loss impact estimates following significant earthquakes worldwide. |
| Phase Data | Description of the motion of, or means of comparison of, periodic waves such as seismic waves. |
| GeoJSON | Format for encoding a variety of geographic data structures. A GeoJSON object may represent a geometry, a feature, or a collection of features. GeoJSON uses the JSON standard. |
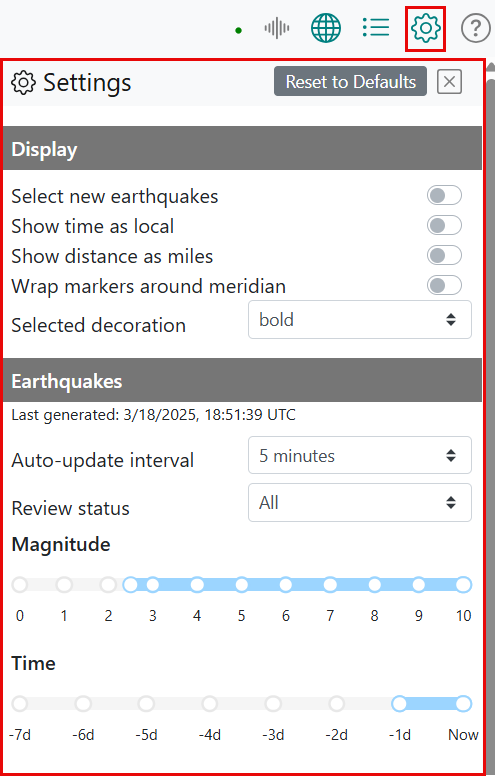
Settings
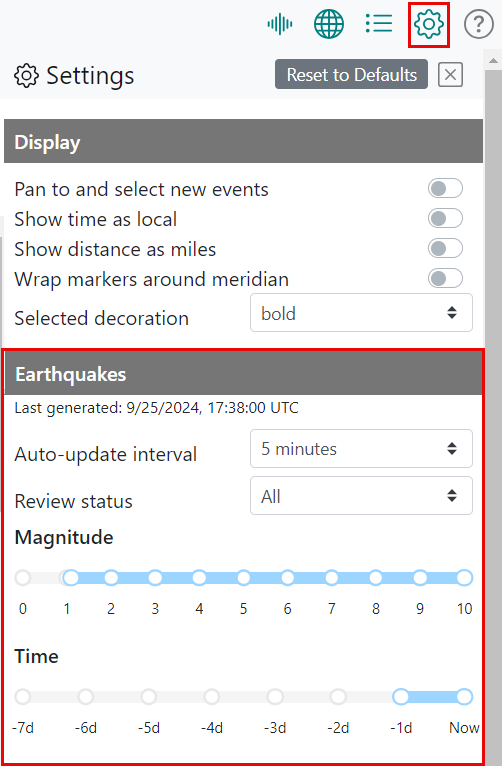
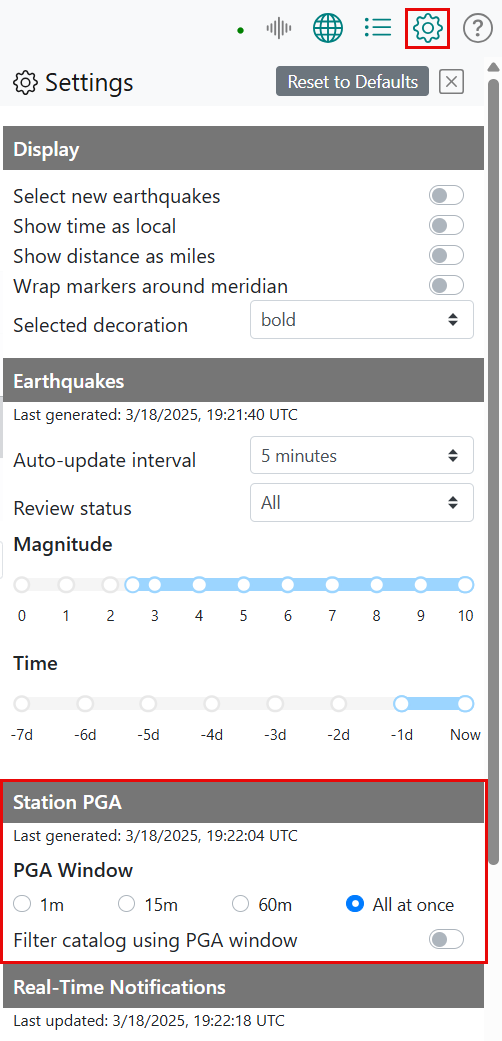
To configure QuakeMap settings, click the Settings icon  in the menu to bring up the Settings pane (Figure 45). Note that Figure 45 does not represent the entire Settings pane; there are additional sections below the Earthquakes settings, and these are described in the sections that follow.
Figure 45. Settings Pane
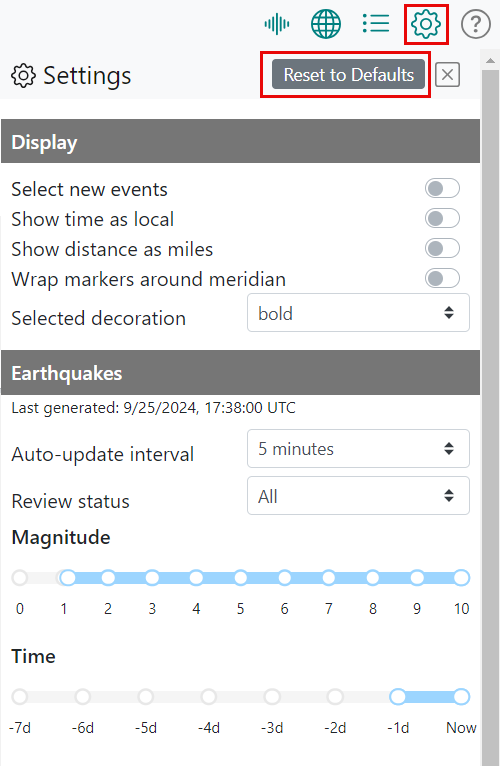
Reset to Defaults
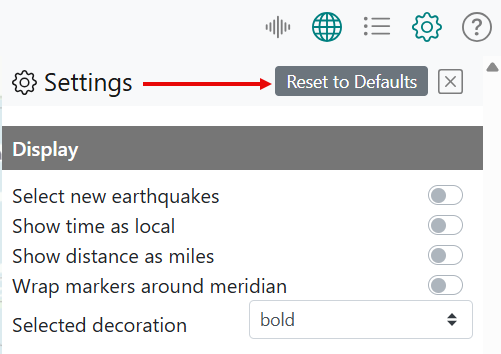
To restore all settings to their default (original) values, from the Settings pane, click Reset to Defaults (Figure 46), which erases any settings from the current or past work sessions and restores QuakeMap to its default state.
|
Once you restore all settings to their default values, your previous settings no longer exist; however, any settings you configure from this point forward will be saved unless or until you click Reset to Defaults again. For more information about your settings as a user, see How User Settings Are Saved. |
Figure 46. Reset to Defaults
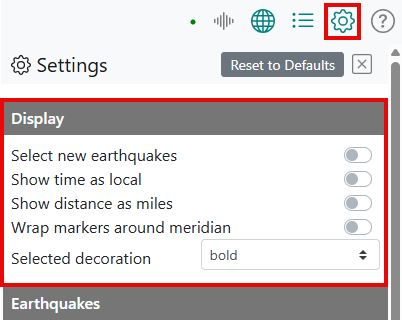
Display
You may configure display options for panning to and selecting new events, time, distance, and wrapping markers around meridians (Figure 47).
Figure 47. Display Options
Select New Earthquakes
By default, this option is off. When turned on and a new earthquake occurs, the earthquake is selected in the following ways:
Selected on the Map pane if the Map pane is open.
Selected in the List pane if the List pane is open.
Selected in the Details pane if the Details pane is open.
Should multiple earthquakes arrive in an update, the newest earthquake will always be the one panned to and selected.
Show Time as Local
By default, QuakeMap shows the time as Coordinated Universal Time (UTC). If you prefer to show your local time instead, turn on the Show time as local toggle.
Show Distance as Miles
By default, QuakeMap shows the distance in kilometers. If you prefer to show distance in miles instead, turn on the Show distance as miles toggle.
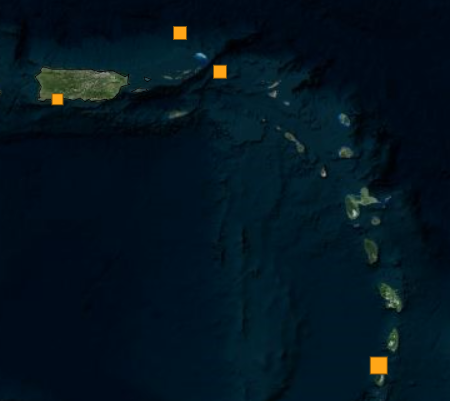
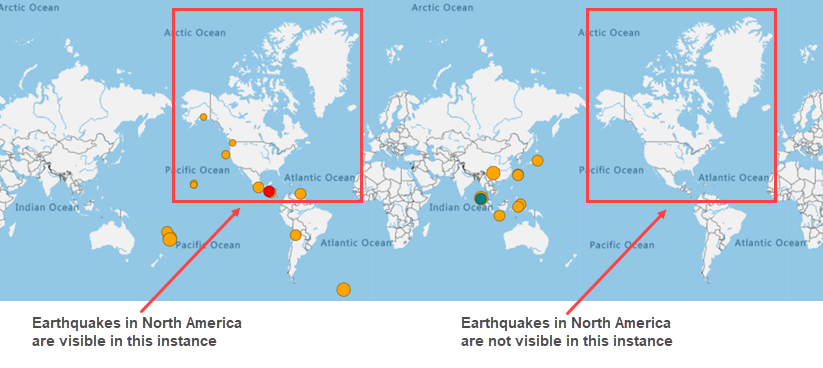
Wrap Markers Around Meridian
By default, the Wrap markers around meridian setting is set to off. Wrapping markers around a meridian repeats earthquake markers when multiple versions of the world are shown on the map. To explain further, consider that when you select World as a preset region to zoom to, you see a continuous view of the world (Figure 48) shows what the map looks like with the World preset enabled and zoomed out to the highest level possible – you see two instances of North America). Because the Wrap markers around meridian setting is set to off, North America’s earthquakes are visible in the leftmost instance, but they are not visible in the rightmost instance. The earthquake markers do not repeat in the next instance of an area (in this case, North America) when you are looking at a continuous view of the world.
Figure 48. Example of Markers Wrapped Around Meridian Turned Off
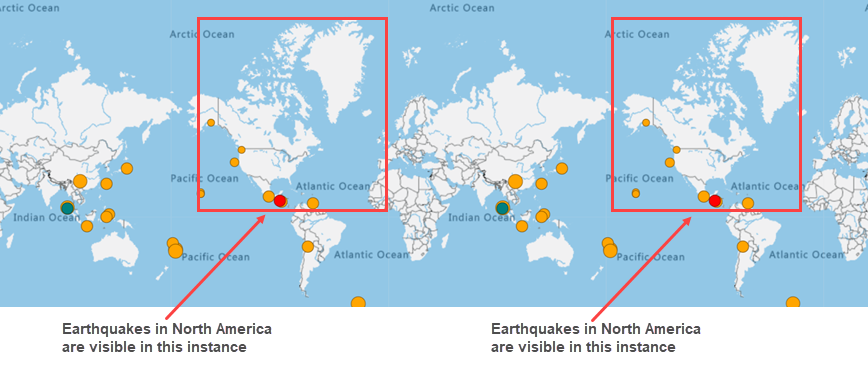
When the Wrap markers around meridian setting is toggled on, you see that North America’s earthquakes are visible in both instances (Figure 49).
Figure 49. Example of Markers Wrapped Around Meridian Turned On
|
The Wrap markers around meridian option is off by default to ensure optimal application performance. |
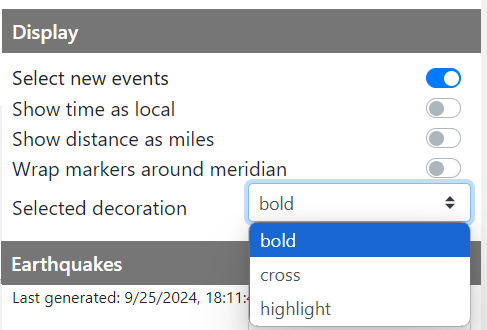
Selected Decoration
Choose how selected events are displayed on the map using the Selected Decoration dropdown. There are three options: Bold, Cross, and Highlight (Figure 50).
Figure 50. Selected Decoration Dropdown
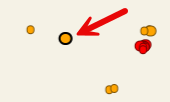
Selected Earthquake: Bold
By default, a selected event is displayed on the map with a bold outline (Figure 51).
Figure 51. Selected Earthquake: Bold
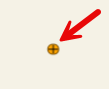
Selected Earthquake: Cross
You can choose to display a selected event on the map as a cross (Figure 52).
Figure 52. Selected Earthquake: Cross
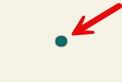
Selected Earthquake: Highlighted
You can choose to highlight a selected event on the map (Figure 53).
Figure 53. Selected Earthquake: Highlight
Earthquakes
Earthquake data is sourced from the ANSS Comprehensive Earthquake Catalog. The earthquake data is provided to QuakeMap end users courtesy of the partnership between CalOES and CGS.
You may configure the earthquake data by auto-update interval, review status, magnitude, and time (Figure 54).
Figure 54. Catalog Options
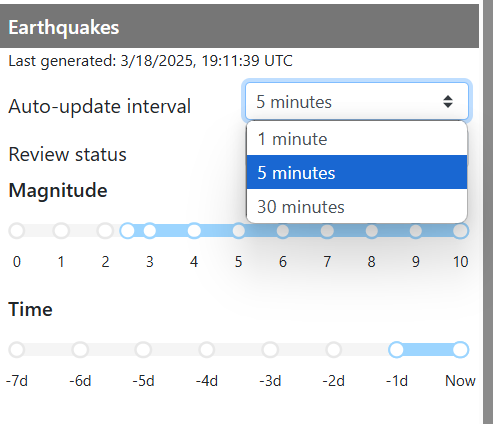
Auto-Update Interval
By default, QuakeMap automatically pulls updates from the ANSS Comprehensive Earthquake Catalog every 5 minutes; however, as shown in Figure 55), you can configure the updates to occur every minute or every 30 minutes. Note that the date and time of the last automatic update are displayed just under the Earthquakes heading.
Figure 55. Auto-Update Interval Options
Review Status
By default, QuakeMap shows all earthquakes in the ANSS catalog, both automatic and reviewed; however, you can choose to show only automatic or only reviewed earthquakes. Select one of these options from the dropdown list (Figure 56).
Figure 56. Review Status Options
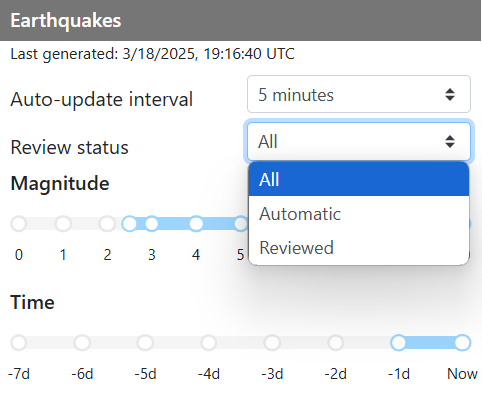
|
Reviewed = a human has reviewed the earthquake. | Automatic = a human has not reviewed the earthquake. |
Filter by Magnitude
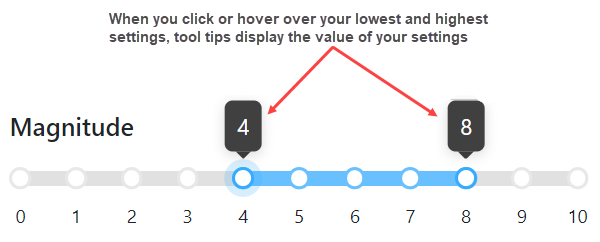
By default, QuakeMap filters earthquakes by magnitudes of 2.5 to 10. QuakeMap uses sliders to enable the filtering of settings, as described in Sliders. Figure 57 shows what these settings look like in the user interface.
Figure 57. Default Magnitude Filter Settings
Move the slider to increase or decrease the magnitude of earthquakes displayed in QuakeMap. As you move the magnitude filter slider, the earthquakes listed in the map and list will update automatically to reflect your new magnitude settings.
|
Hover over or click your lowest and highest settings to see tooltips that display the value of your settings. |
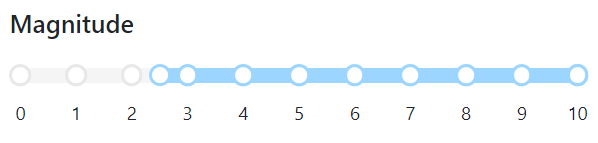
(Figure 58) shows an example of a magnitude setting that displays only earthquakes that have magnitudes of 4 to 8.
Figure 58. Example of Newly Configured Magnitude Filter Settings
Filter by Time
By default, QuakeMap filters earthquakes to show those that occurred in the last [1] day to now (last 24 hours as of current time). To enable the filtering of settings, QuakeMap uses sliders, which are described in Sliders. Figure 59 shows what these default settings look like in the user interface.
Figure 59. Time Filter
![The default time filter settings are shown on the time slider (the last [1] day to now).](media/image102.png)
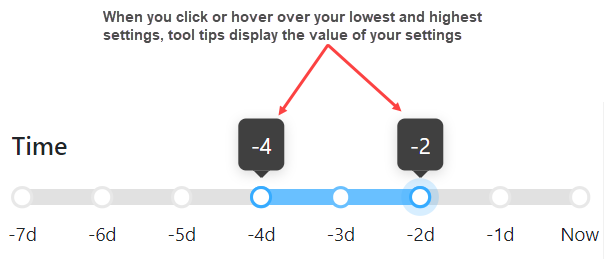
Move the slider to increase or decrease the time (in days) for earthquakes to display. As you move the time filter slider, the earthquakes listed in the map and list will update automatically to reflect your new time settings.
|
Hover over or click your lowest and highest settings to see tooltips that display the value of your settings. |
Figure 60 is an example of a time filter setting ranging from 4 days before the present day to 2 days before the present day.
Figure 60. Example of Newly Configured Time Filter Settings
|
Sections Station PGA, Real-Time Notifications, and Authentication Settings of this user guide apply to authenticated users only. Authenticated users are typically Emergency Responders who require immediate access to earthquake hazard information. If you are authorized to receive real-time notifications, ask your emergency response manager for your login credentials. |
Station PGA – For Authenticated Users Only
As described in Station PGA on the Map, QuakeMap’s real-time server creates a PGA report and sends it to QuakeMap to display. The PGA report includes three PGA values for each station, with each value averaged over three different time windows (in minutes): 1m, 15m, and 60m.
The Settings pane contains a Station PGA area where you can choose which PGA window is reflected on the map (Figure 61).
Figure 61. Station PGA in Settings Pane
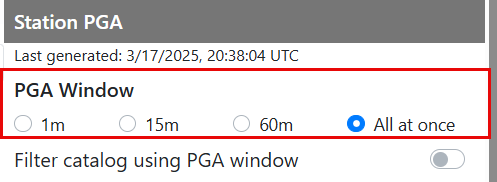
Set Station PGA Window
In the Settings pane, you can set the station PGA window to one of three values (in minutes): 1m, 15m, and 60m. You can also select All at once (Figure 62) to use all three values. A PGA window represents the average of all values across the respective time window, so a 1m window represents the average of all values across the 1m time window. As you click each PGA window radio button shown below in Figure 62, the map updates to reflect the window’s average value for each station. See Station PGA in the Legend to learn how the map legend defines the stations’ PGA values.
Figure 62. PGA Window
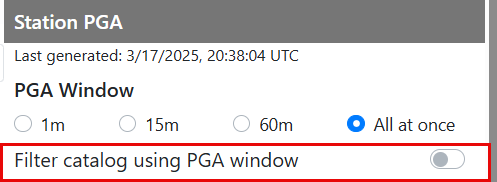
Filter Earthquakes on Map by PGA Window
To filter earthquakes on the map based on your selected PGA window, toggle on the Filter catalog using PGA window switch (Figure 63). For example, if you select the 60m radio button and toggle on the Filter catalog using PGA window switch, the map and list will display earthquakes that occurred in the last 60 minutes only. Selecting the All at Once radio button results in the earthquakes being filtered using all PGA windows.
Figure 63. Filter Catalog Using PGA Window
Real-Time Notifications – For Authenticated Users Only
As an authenticated user, QuakeMap pushes real-time notifications about earthquakes to you as they happen, but only when you are connected to the system. For information about connecting to the system, see Getting Started as an Authenticated User.
See New and Updated Events in the List, Enable Real-Time Notifications, Filter Real-Time Notifications by Magnitude, and Filter Real-Time Notifications by Time to learn about the additional features provided to authenticated users.
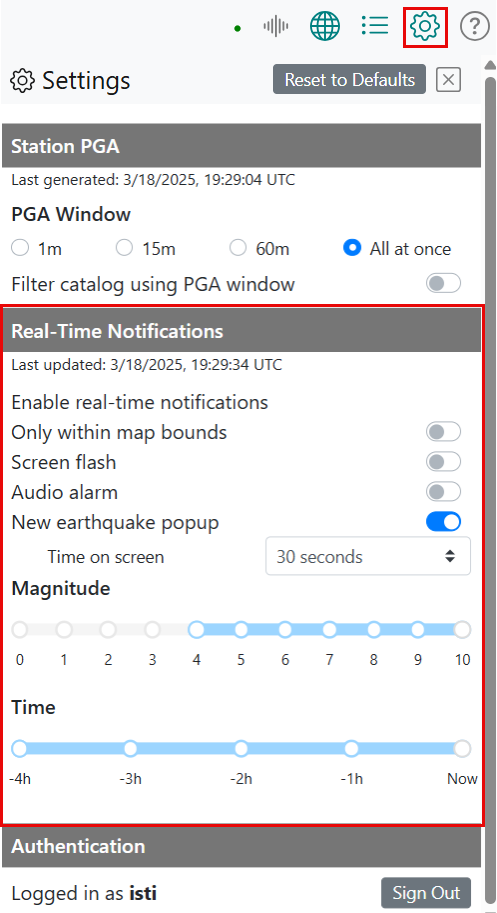
The Settings pane has a Real-Time Notifications area where you can select options for how you are notified of new events (Figure 64).
Figure 64. Real-Time Notifications in Settings Pane
Enable Real-Time Notifications
Toggle on or off each of the following settings to select how you want to be notified of new earthquakes:
Screen flash - Your screen flashes red when a new event appears.
Audio Alarm - An alarm sounds when a new event appears.
New Earthquake popup (by default, this is set to on) - A popup with new earthquake summary information appears on the left side of your screen. Figure 65 shows four New Earthquake popups displayed simultaneously on the screen.
Figure 65. New Earthquake Popups Displayed on Screen
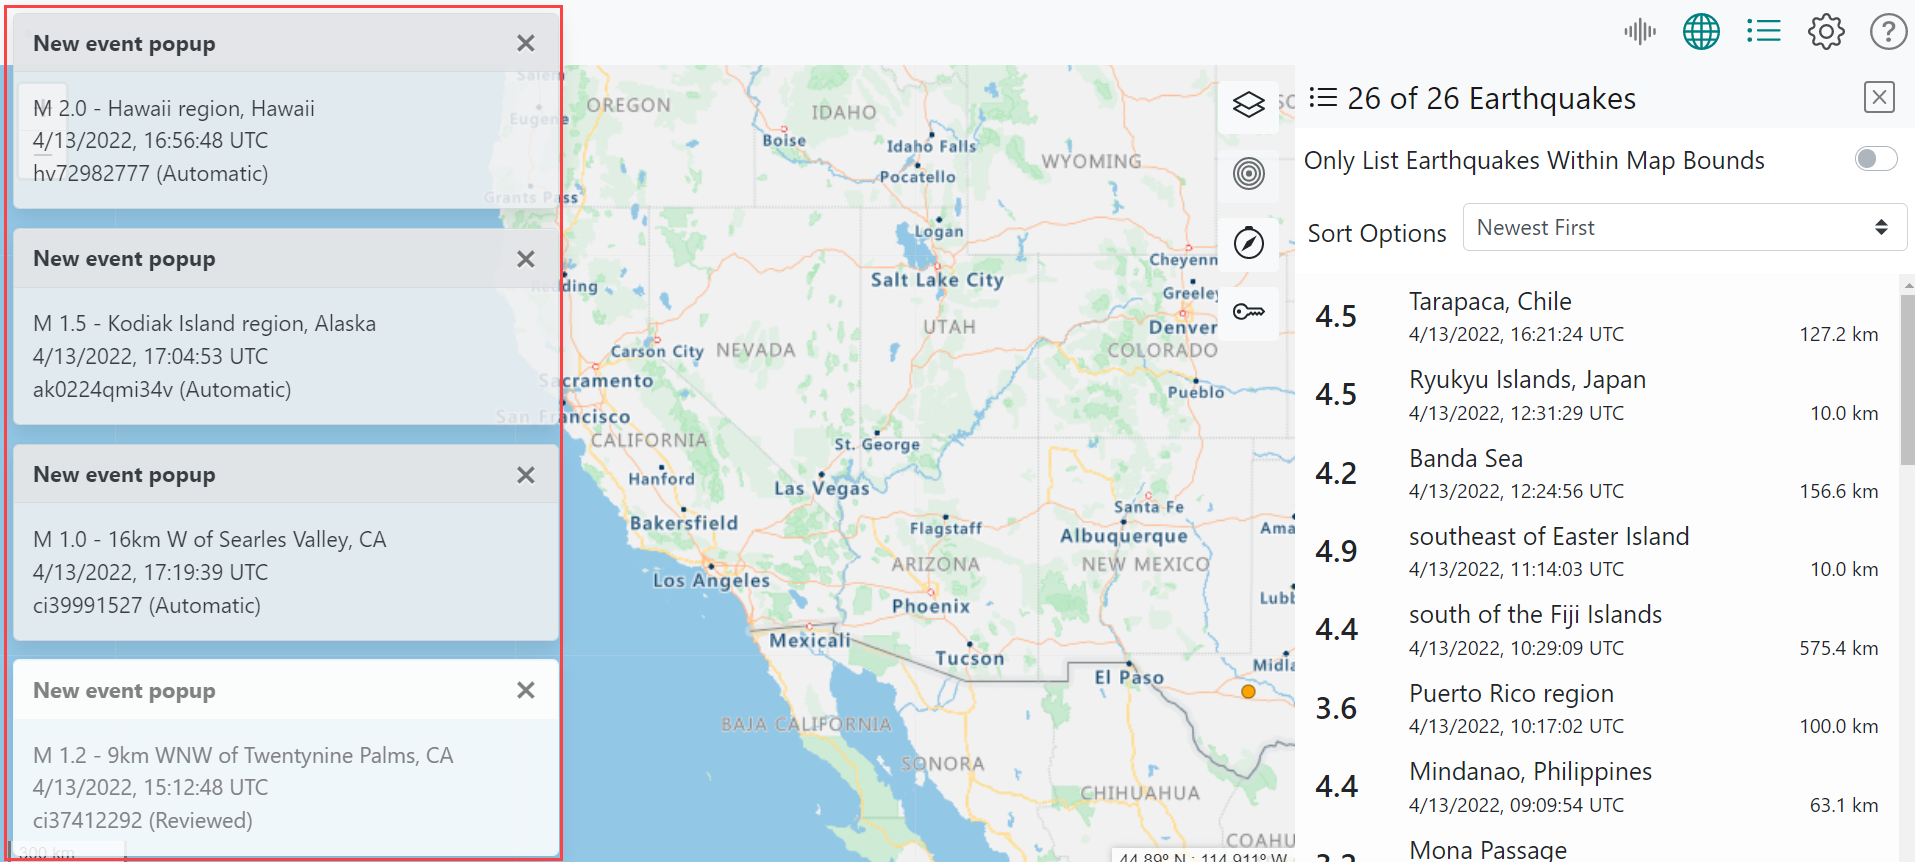
|
New Earthquake popups are either white (reviewed by a human) or gray (automatic - not reviewed by a human). |
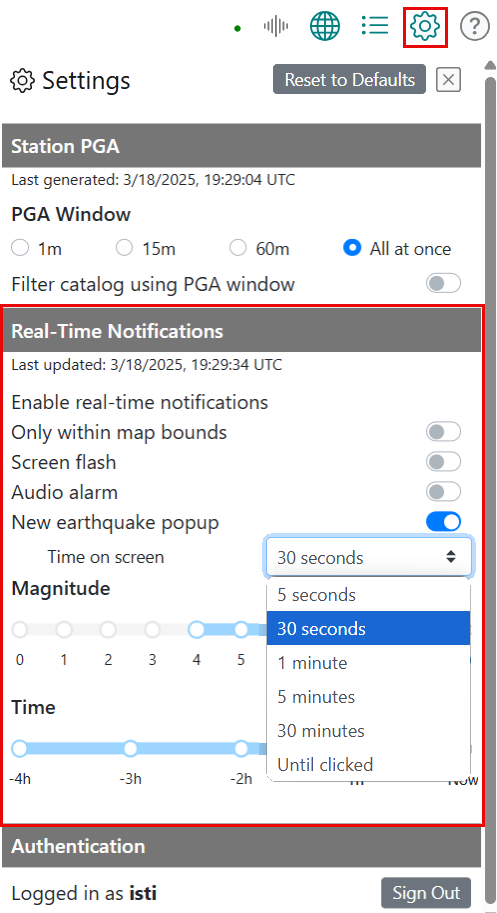
To configure how long a New Earthquake popup will stay visible on your screen, select one of five options from the Time on screen dropdown shown in Figure 66. Note that the Until clicked option keeps a New Earthquake popup displayed on your screen until you click the to close it.
Figure 66. New Earthquake Popup Time on Screen
Filter Real-Time Notifications by Magnitude
By default, QuakeMap filters real-time notifications by magnitudes of 4 to 10. To enable the filtering of settings, QuakeMap uses sliders, which are described in Sliders. Figure 67) shows what these settings look like in the user interface.
Figure 67. Default Real-Time Notification Magnitude Filter Settings
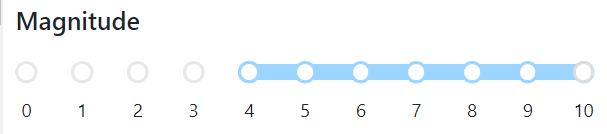
Move the slider to increase or decrease the magnitude of real-time events displayed in QuakeMap. As you move the magnitude filter slider, the new events shown in the map and list will update automatically to reflect your new magnitude settings.
|
Hover over or click your lowest and highest settings to see tooltips that display the value of your settings. |
Filter Real-Time Notifications by Time
By default, QuakeMap filters the real-time notifications by events that occurred in the last four hours to now (current hour). To enable the filtering of settings, QuakeMap uses sliders, which are described in Sliders. Figure 68 shows what these default settings look like in the user interface.
Figure 68. Default Real-Time Notification Time Filter Settings
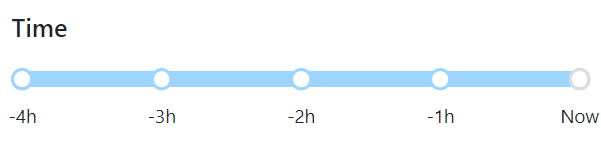
Move the slider to increase or decrease the time (in hours) for events to display. As you move the time filter slider, the earthquakes listed in the map and list will update automatically to reflect your new time settings.
|
Hover over or click your lowest and highest settings to see tooltips that display the value of your settings. |
Authentication Settings – For Authenticated Users Only
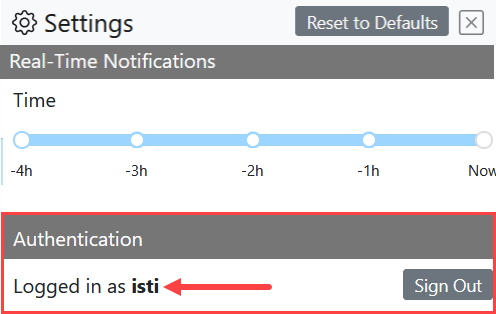
Username
At the bottom of the Settings pane is the Authentication area, which indicates the username credential under which the authenticated user logged in (Figure 69).
Figure 69. Authenticated User's Login Credential
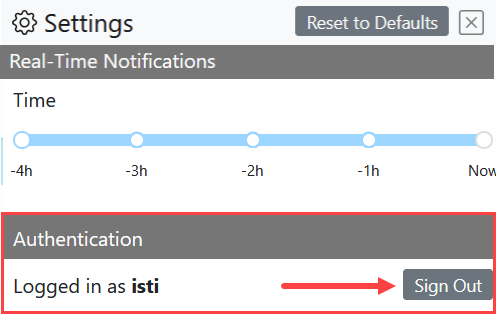
Sign Out
To sign out of QuakeMap, click the Sign Out button in the Authentication area of the Settings pane (Figure 70).
Figure 70. Sign Out Button
Help
To access QuakeMap help, follow the steps below:
Click the Help icon
 on the menu. The Help pane opens to its full width (Figure 71).
Figure 71. Help Pane
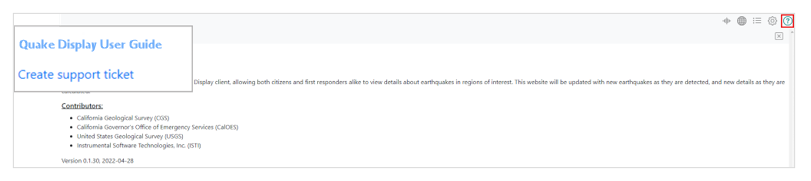
Choose among the following options:
QuakeMap User Guide – click to view the user guide.
Create support ticket – click to open your email program with a blank email containing QuakeMap’s support email address.
Enter a subject in the email subject line.
Describe your issue in the body of the email.
Press Send. QuakeMap Support will review and address tickets.
Close the Help pane by re-clicking the Help icon
or clicking . The system returns you to the panes you were previously working on.
|
The version number and date of the latest QuakeMap release are displayed at the bottom of the Help pane. |